This post started off as quite a mundane analysis of workaday stats, but I think that analysis led to a reasonably interesting conclusion.
The catalyst was the recent match between India and Sri Lanka in Kanpur and, in particular, India's innings. They amassed 642, which proved quite enough to see Sri Lanka off by an innings and plenty; nevertheless, that impressive total was a bit of a comedown, given they had been 613/4 a dozen or so overs before they were bowled out. That's quite a collapse. A contributor to the Cricinfo text commentary summed it up rather neatly:
I have never seen such an unbalanced score card. When we look at the runs it is so lopsided on the the top that I feel my Cricinfo page will roll over by 180°.
I was party to some related discussions on both TMSB Exiles and Grockles. On the latter, Frome Exile came up with an interesting way of looking at the collapse: he worked out that there had only been one instance in test history of a larger absolute difference between the contributions of the first five partnerships and the last five. That was England's monstrous first innings of 849ao v. West Indies in Kingston, 1930, in which the fifth wicket fell at 720, meaning the first five wickets added 591 more than the last five (11 more than the corresponding discrepancy in India's Kanpur innings). In case anyone's interested, I've put a full list of test innings sorted in this way here.
A similar – though, I think, ever-so-slightly more informative – way of looking at the question is to concentrate on the relative difference between the amount of runs scored for the first five wickets and the amount scored for the second five – in other words, the proportion of the the final, all-out total that was contributed by the first five partnerships. The table below shows score at the fall of the fifth wicket, final total, and the relationship between the two for all all-out innings in test history (obviously, it doesn't make sense to ask the same question of innings that were declared or otherwise prematurely curtailed). The match at the top of the list is a famous, though statistically anomalous one, which only technically counts as an all-out innings.
The Sabina Park massacre aside, the most lopsided innings is one in which Australia's first 5 partnerships scored 61 times as many runs as the rest. In fact, the collapse was more dramatic than even that stat suggests, because the fifth-wicket partnership also realised no runs, so Australia – chasing 382 to win the match – fell from 305/3 to 310ao. The prime architect of Australia's demise was Sarfraz Nawaz, who took 7/1 in a spell of 33 balls, to finish with career-best figures of 9/86. Some sources refer to Sarfraz's feat as the first great spell of reverse-swing bowling in tests; others note that he took the new ball just before the rampage began, which would make such an interpretation unlikely. One way or another, it was a sensationally effective burst.
            5thWkt   Total       (%)   Team           Inns     Match
       1.       97      97   100.00%   India          2nd inns -v- West Indies at Sabina Park, Kingston, 1975/76
       2.      305     310    98.39%   Australia      2nd inns -v- Pakistan at Melbourne Cricket Ground, 1978/79
       3.      261     266    98.12%   New Zealand    1st inns -v- Pakistan at Basin Reserve, Wellington, 1964/65
       4.      147     150    98.00%   England        2nd inns -v- Australia at Melbourne Cricket Ground, 1990/91
       5.      244     249    97.99%   Australia      1st inns -v- England at Trent Bridge, Nottingham, 1953
       6.      493     507    97.24%   England        1st inns -v- Pakistan at National Stadium, Karachi, 1961/62
       7.      127     131    96.95%   New Zealand    2nd inns -v- Pakistan at Eden Park, Auckland, 2000/01
       8.      221     228    96.93%   England        2nd inns -v- Australia at Adelaide Oval, 1950/51
       9.      204     211    96.68%   India          2nd inns -v- England at Trent Bridge, Nottingham, 1996
      10.      169     175    96.57%   Sri Lanka      2nd inns -v- England at P Saravanamuttu Stadium, Colombo, 1981/82
      11.      418     433    96.54%   Australia      1st inns -v- England at Brisbane Cricket Ground, Woolloongabba, Brisbane, 1970/71
      12.      554     576    96.18%   West Indies    1st inns -v- India at Sabina Park, Kingston, 1952/53
      13.      275     286    96.15%   Pakistan       2nd inns -v- India at MA Chidambaram Stadium, Chepauk, Chennai, 1998/99
      14.      323     336    96.13%   West Indies    1st inns -v- England at Edgbaston, Birmingham, 2004
      15.      213     222    95.95%   Australia      1st inns -v- England at Edgbaston, Birmingham, 1968
      16.      535     558    95.88%   West Indies    1st inns -v- England at Trent Bridge, Nottingham, 1950
      17.      507     529    95.84%   England        1st inns -v- Australia at Melbourne Cricket Ground, 1974/75
      18.      247     258    95.74%   Australia      1st inns -v- England at Melbourne Cricket Ground, 1978/79
      19.      134     140    95.71%   South Africa   1st inns -v- England at Lord's Cricket Ground, St John's Wood, 1907
      20.      488     510    95.69%   Australia      1st inns -v- West Indies at Melbourne Cricket Ground, 1968/69
      21.      350     366    95.63%   India          1st inns -v- Australia at Melbourne Cricket Ground, 2003/04
      22.      368     385    95.58%   Sri Lanka      1st inns -v- India at P Saravanamuttu Stadium, Colombo, 1985
      23.       85      89    95.51%   West Indies    1st inns -v- England at Kennington Oval, 1957
      24.      613     642    95.48%   India          1st inns -v- Sri Lanka at Modi Stadium, Kanpur, 2009/10
      25.      376     394    95.43%   West Indies    1st inns -v- India at Kensington Oval, Bridgetown, 2001/02
      26.      285     299    95.32%   Pakistan       1st inns -v- Sri Lanka at Sinhalese Sports Club Ground, Colombo, 2009
      27.      240     252    95.24%   Pakistan       1st inns -v- South Africa at Newlands, Cape Town, 2002/03
      28.      198     208    95.19%   England        1st inns -v- South Africa at Trent Bridge, Nottingham, 1947
      29.      270     284    95.07%   England        1st inns -v- Australia at Melbourne Cricket Ground, 1920/21
      30.       77      81    95.06%   India          2nd inns -v- New Zealand at Basin Reserve, Wellington, 1975/76
     ...
     ...
    4909.        7      70    10.00%   Australia      2nd inns -v- England at Old Trafford, Manchester, 1888
    4910.       32     323     9.91%   Australia      1st inns -v- England at Melbourne Cricket Ground, 1897/98
    4911.       18     185     9.73%   Zimbabwe       2nd inns -v- India at Queens Sports Club, Bulawayo, 2005/06
    4912.       23     258     8.91%   England        1st inns -v- West Indies at Queen's Park Oval, Port of Spain, 1934/35
    4913.       14     169     8.28%   Bangladesh     2nd inns -v- Zimbabwe at Harare Sports Club, 2003/04
    4914.       15     212     7.08%   Pakistan       2nd inns -v- Sri Lanka at Jinnah Stadium, Sialkot, 1995/96
    4915.        6      98     6.12%   India          1st inns -v- England at Kennington Oval, 1952

only all-out innings considered; figures correct at 27-Nov-2009; full list available here
India's Kanpur innings is 24th on the list, one of 30 test innings in which the last five wickets contributing less than five percent of the all-out total. At the other end of the table, there are seven instances of the first five partnerships providing 10% or less of the final score. That entry at the bottom isn't, as I immediately imagined, Trueman's debut, when India were famously reduced to 0/4; it's the fourth match of that series, in which they managed a whole 6 runs before losing their 4th wicket, but lost their 5th the next ball. On this occasion, it was Trueman's opening partner, Alec Bedser, who was the main destroyer; Norman Preston's Wisden write-up describes the carnage – and the subsequent revival led by Indian skipper Vijay Hazare – in detail.
Here's where the story begins to get a bit interesting. Having assembled all these stats, I casually had a glance at the typical relationship between these two variables (the amount of runs scored for the first five wickets, and the amount of runs scored in the remainder of the innings). The results were nothing like what I was expecting.
It turns out that score at the fall of the 5th wicket is a terrible predictor of the amount the last five wickets will contribute. I would have imagined that instances in which the first half of an innings was high-scoring would – noteworthy collapses aside – have been those in which the second half also went well for the batting team. Similarly, you'd guess that, if the first 5 fall over cheaply, the tail are unlikely to contribute much. It turns out that you can't make those sorts of assumption at all.
The graph below shows every all-out innings in test history, with runs for the first five wickets on the x-axis plotted against runs for the last 5 on the y. Before generating this plot, I expected to see a fairly noticeable positive correlation, with the datapoints lining up from the origin of the graph in a positive trend up and right. No such thing. It's all scatter and no plot, and r2 (which quantifies the strength of association between two variables – see this earlier post) is a dismal 0.0041.
Figure 1: All-out test innings – runs for the first five wickets and runs for the last five
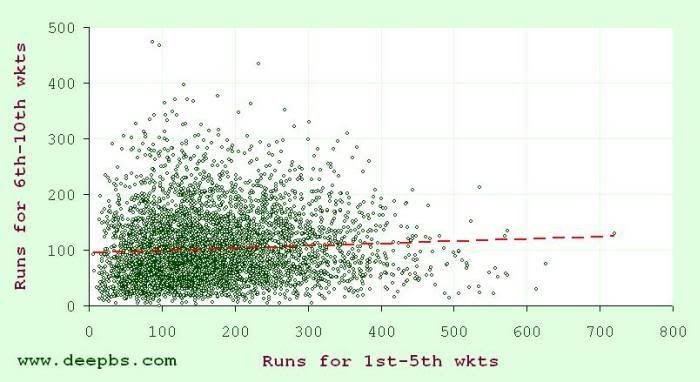
If you stick a linear regression line through the dataset (as I have, above), you get y = 95.5 + 0.0414x, which means that, at the fall of the fifth wicket, our best guess of what the all-out total will be is
runs scored so far + (0.0414 × runs scored so far) + 95.5
... but what this analysis shows very clearly is that you'd be an idiot to head off down the bookie's armed with that equation, because our best guess is dreadful. In fact, if it tells us anything, it suggests that dramatic collapses and dramatic tail-wagging are much more likely than you might imagine (maybe there's some value to be had there!) The lesson is clear: what happens in the first half of an innings tells us nothing about what we can expect in the second half. For example, on average throughout test history, whenever the fifth wicket has fallen at a score between 50 and 99, the remaining batsmen have added a further 95.7; whenever the first five partnerships have realised between 400 and 449, the last five wickets have typically amassed... 95.3.
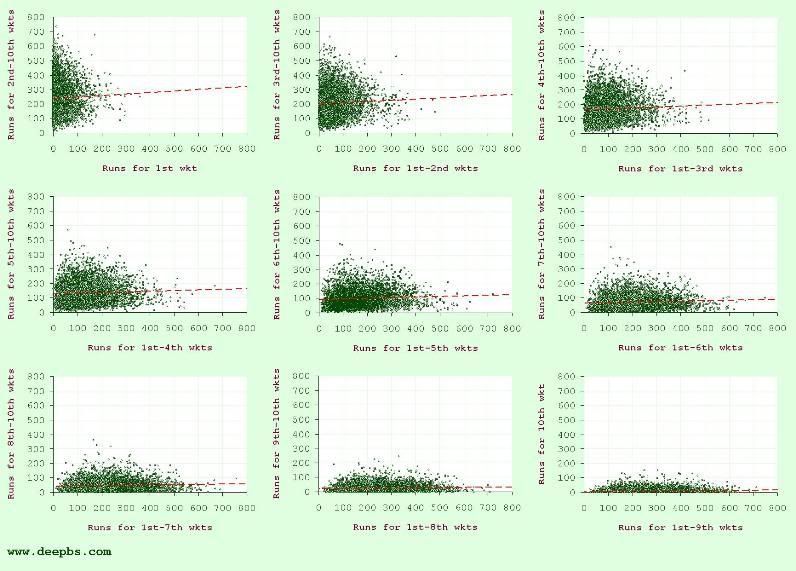
Further investigation shows that this finding is not confined to the fifth wicket. At any stage of a test innings, what has happened up until the fall of a given wicket is a useless predictor of what's going to happen afterwards. Figure 2 shows analogous graphs to that shown above for all other wickets. In every case, there's a whole lot of noise and no noticeable signal. The highest r2 for any of these analyses is that calculated for the ninth wicket – just 0.0053 (that is: only half a percent of the variance in the tenth-wicket partnership scores is explained by variability in totals at the fall of the ninth).
Figure 2: All-out test innings – correlations between scores before and after the loss of each wicket
I don't quite know what to make of these findings. At extreme ends of the spectrum, one can just about understand how two halves of an innings might compensate for each other. As Wickham observed on Grockles,
Part of the explanation may be that tail-enders are more likely to dig in if the top-order batsmen have scored relatively few runs and that this tendency helps to counteract the impact of wickets which are more difficult to bat on.
I am sure this is a useful observation. It seems to me that the reverse may be true, as well: if the top order have scored heavily, maybe the tail play with abandon in search of the quick runs that the match situation is likely to demand, and thereby score less heavily than they might have done. I don't know that these explanations help us with the majority of test innings, however. After all, most times, the tail are neither digging in for grim death nor swinging with carefree abandon.
The alternative explanation is that we massively overinterpret those factors we identify as significant in shaping an innings. We watch five batsmen fall quickly, and we conclude that the wicket is unreliable, or the bowlers irresistible; when the runs have come easily for the top order, we imagine that the conditions are favourable, or the attack toothless. But maybe we've got a bad appreciation of the random and – pace Louis MacNeice – cricket is crazier and more of it than we think. This is far from the first time that, having had a good dig into the evidence, I've reached the conclusion that the game is far more susceptible to dumb luck than we ever acknowledge.


"A similar – though, I think, ever-so-slightly more informative – way of looking at the question"
ReplyDeleteWell, yiou would say that, wouldn't you! ;-)
Frome Exile.
But seriously, keep up the very impressive work!
This is excellent. I've been pondering it all day and will probably continue to do so for days to come. Amongst the many things that interest me about it is that if you polled Test cricketers about whether they thought the runs scored by the top 5 batsmen would be a good predictor of the runs scored by the rest of the line-up, I'm sure they would say 'yes'. In other words, they are ignorant of a truth about the game they play.
ReplyDeleteAre you writing anywhere else now?
Chris (Declaration Game cricket blog) @chrisps01