This series of posts was inspired by the notable exploits of Marcus Trescothick in 2009 (well, we Somerset supporters think they're notable, whether you do or not). He was the English season's leading scorer, amassing 2,934 runs across all competitions, and deserved winner of the PCA's 2009 MVP award as well as their Players' Player of the Year.
One particular milestone is that Trescothick's career batting average has, at the end of the current season, risen above 40, for the first time since he opened his first-class account (in a remarkable 1993 match that Somerset fans remember fondly for reasons that have nothing to do with the debutant). Admittedly, this doesn't sound like so momentous a watershed for a performer of supposed world class, especially in this run-heavy era. These days, after all, there are players who consistently average over 40 without causing much more than a faint blip on the international radar. However, to understand quite what an achievement it has been for Trescothick to drag his average above this level, it needs to be emphasised quite how poor – and quite how prolongedly poor – the first part of his career was.
When he made his test debut – v. West Indies in 2000 – Trescothick had a batting average of 30.60 from 168 first-class innings. (The identification of a true talent hiding beneath that less-than-mediocre record is one of the few shreds of evidence that Duncan Fletcher knows the first thing about cricket, if you ask me.) Trescothick, of course, made a confident 50 in his first test innings, and never looked back. For the next few years, his cricket was played almost exclusively for England (in 2004, he didn't play a single game for Somerset) and his successful international career provided a substantial fillip to his average. By the time he played his last first-class game in England colours (that infamous encounter with Pakistan at the Oval in 2006), his average had risen to 35.75 from 360 FC knocks.
Since the beginning of 2007 – for reasons that have been documented, where they have not been fabricated, elsewhere – Trescothick has been a Somerset cricketer exclusively. Undoubtedly, England have been the poorer for his absence; you'll forgive us Taunton regulars a little parochialism if we don't entirely share the regret felt by cricket fans in other corners of the country. Across those three seasons, he has scored 4,418 runs in 48 FC matches at an average of 60.52.
2009 has been Trescothick's best season yet. He has scored 1,817 FC runs at 75.70, with 8 centuries. Only Jimmy Cook (11 in 1991 & 9 in 1990), Bill Alley (10 in 1961), and Viv Richards (9 in 1985) have scored more tons in a season for Somerset, and each of them had more matches in which to do so. In the process, he has passed 10,000 FC runs for the county. And when he was dismissed for 102 in the match against Lancashire at Taunton earlier this month, his average – at long last, 436 innings into his FC career – rose above 40.
So what may be remarkable about Trescothick's career trajectory is how he has slowly-but-steadily dragged himself up by the pad-straps from a distinctly unpromising beginning to arrive at a record that begins to do justice to his recognised abilities. Over on (everyone's favourite Somerset CCC messageboard) www.grockles.com, Loyal of Lhasa commented:
MT has now played for almost seventeen seasons and it is in this season that he has scored 10% of his career aggregate. I'm not sure how significant that is...
This struck me as a rather interesting question, so I did a bit of research on it, which led on to a bunch of additional questions.
There are two important notes to make about the analyses that follow. Firstly, they all revolve around calendar years rather than seasons. This is partially for the bad reason that it's much easier to extract years from my database, but also for the good reason that it makes observations slightly less noisy (lessening the possibility that a few freak innings might dominate the period in question). Secondly, all these analyses look at run aggregates alone when, in several instances, we might more naturally think in terms of batting averages. After all, no two years provide exactly the same opportunity to score runs, which is where the average comes in handy. My reliance on year-end aggregates isn't because I believe them to be some sort of superior metric for measuring a batsman's quality; it's just because they're what I'm interested in at the moment, in the light of Trescothick's high-scoring year. Most of the analyses could be rerun using averages, etc.; if anyone's interested to see them, let me know.
A very good year
It turns out that the fact that Trescothick scored 10% of his career runs in a single season may not be very significant at all. More than half of the 838 batsmen with 10,000 FC runs or more have gone through a calendar year in which they scored a higher proportion of their career runs than Trescothick has this year. Top of the lot is David Hussey, who racked up over a quarter of his life's runs in 2007. Below are the top few and the bottom few and a few notable anni mirabiles ('scuse slight Somerset bias) from in-between:
Table 1: The proportion of a batsman's career runs scored in his highest-scoring calendar year
      Name                 CareerYrs   CareerRuns     BestYr   BestYrRuns       %
1.    DJ Hussey                    7       10,048       2007        2,722   27.1%
2.    AR Morris                   14       12,614       1948        3,149   25.0%
3.    FMM Worrell                 22       15,025       1950        3,738   24.9%
4.    VM Merchant                 21       13,470       1946        3,224   23.9%
5.    J Darling                   14       10,635       1899        2,530   23.8%
6.    CF Walters                  13       12,145       1933        2,832   23.3%
7.    PA Jaques                    9       11,707       2005        2,728   23.3%
8.    ED Weekes                   19       12,010       1950        2,749   22.9%
9.    BC Booth                    14       11,265       1964        2,536   22.5%
10.   RM Cowper                   11       10,595       1964        2,344   22.1%
11.   CJL Rogers                  12       12,464       2006        2,705   21.7%
12.   J Ryder                     21       10,501       1921        2,247   21.4%
13.   JC Adams                    18       11,234       1994        2,375   21.1%
14.   WJ Cronje                   13       12,103       1995        2,551   21.1%
15.   CG Macartney                21       15,019       1921        3,147   21.0%
16.   CH Gayle                    12       11,256       2001        2,325   20.7%
17.   MD Crowe                    16       19,608       1987        4,045   20.6%
18.   GHG Doggart                 14       10,054       1949        2,063   20.5%
19.   KR Stackpole                14       10,100       1972        2,053   20.3%
20.   WA Brown                    16       13,838       1938        2,793   20.2%
...
31.   VT Trumper                  19       16,939       1902        3,220   19.0%
...
56.   BC Lara                     20       22,156       1994        3,828   17.3%
...
68.   WH Ponsford                 14       13,819       1930        2,311   16.7%
...
84.   RN Harvey                   18       21,699       1953        3,506   16.2%
...
108.  DG Bradman                  20       28,067       1930        4,368   15.6%
...
118.  SJ Cook                     24       21,143       1991        3,234   15.3%
...
172.  MEK Hussey                  16       19,242       2001        2,711   14.1%
...
265.  DCS Compton                 22       38,942       1947        4,962   12.7%
...
456.  ME Trescothick              17       16,645       2009        1,817   10.9%
...
522.  L Hutton                    19       40,140       1948        4,167   10.4%
...
595.  GS Sobers                   22       28,314       1968        2,745    9.7%
...
701.  WR Hammond                  26       50,551       1933        4,422    8.7%
...
714.  H Sutcliffe                 22       50,670       1932        4,373    8.6%
...
716.  GA Hick                     26       41,112       1988        3,540    8.6%
717.  SR Waugh                    21       24,052       1988        2,071    8.6%
...
725.  IVA Richards                22       36,212       1976        3,080    8.5%
...
827.  G Boycott                   25       48,426       1970        3,109    6.4%
828.  PA Perrin                   29       29,709       1906        1,893    6.4%
829.  EM Grace                    33       10,025       1883          638    6.4%
830.  CT Radley                   24       26,441       1975        1,667    6.3%
831.  A Jones                     27       36,049       1963        2,159    6.0%
832.  KWR Fletcher                27       37,665       1968        2,248    6.0%
833.  G Gunn                      27       35,208       1908        2,032    5.8%
834.  FE Woolley                  29       58,959       1929        3,389    5.7%
835.  WG Quaife                   31       36,012       1905        2,060    5.7%
836.  JB Hobbs                    26       61,760       1914        3,524    5.7%
837.  DB Close                    35       34,994       1959        1,990    5.7%
838.  WG Grace                    44       54,211       1871        2,739    5.1%

figures correct at end of English FC season 2009; full list available here
The problem with this mode of analysis is that it doesn't take account of the length of a batsman's career. As Loyal of Lhasa responded,
at the end of one's first season one has by definition scored 100% of one's career runs in a single season.
Accordingly, it is no surprise to see some of the longest FC careers at the bottom of the list (to have joined the 10% club, Grace, Hobbs, or Woolley would have had to amass more than 5,000 of their runs in a single year). Back on www.grockles.com, Frome Exile made some similar comments:
[David] Hussey has a quarter of his runs in one seventh of his "years" which is hardly as remarkable as [Arthur] Morris' quarter of his runs in one fourteenth of his years.
Perhaps a more interesting analysis, then, would be one that attempted to capture the extent to which a batsman's best season was truly exceptional, when compared with the rest of his career. Perhaps you could weight the percentage figure according to the number of seasons played; mathematically, this is identical to finding the batsman's mean year score (i.e. what you'd typically expect him to score in any given year), and calculating the ratio of the exceptional year to the typical one. For example, when WG Grace scored 2,739 runs at the height of his early-career rampage in 1871, that was over twice as much as the 1,232 runs he scored per year on average throughout his career; in contrast, Hobbs's 1914 aggregate was only 48% higher than the 2,375 runs you could expect from him in any given year. So, of course, Frome Exile is entirely right: David Hussey's 2007 runfest amounted to a total that was 90% higher than his typical year's tally, whereas Morris's 1948 aggregate was three-and-a-half times higher than he managed, on average, through his career.
There's a problem with taking a simple ratio of extreme:mean, though, and that's that what makes an extreme observation unusal is not just its relationship to the mean, but how it corresponds to the whole set of observations. Statisticians would say we are interested in how the variable is distributed. To illustrate the importance of this, consider the following: The mean weight of males aged 20 or over is 13st 12lb, so someone who is 20% above average would be 16st 9lb (i.e. a bit of a porker, but nothing outlandish: the kind of bloke you pass in the street every day without thinking anything of it). On the other hand, the mean height of males aged 20 or over is 5'9", but someone who is 20% above average would be 6'11" (i.e. really quite unusually monstrous: the kind of bloke you certainly do notice when you pass him in the street). So the same 20% increment can produce results that are more or less exceptional, depending on the way the observations are distributed.
Fortunately, there is a well established way to quantify the exceptional-ness of a particular observation within a distribution. That method is the z-score. To calculate a z-score, one needs to know the mean and the standard deviation of the distribution in question; the z-score is simply the number of standard deviations between the extreme observation and the mean.
(Note for stats-heads: I did a bit of analysis, and it turns out that calendar-year aggregates tend to be pretty normally distributed. Although there's no reason why z-scores can't be calculated for asymmetric – and other non-normal – distributions, it's reassuring to know that we're not dealing with anything kinky, here.)
Calculating the z-score for each batsman's most productive year gives the following list:
Table 2: Batsmen's highest-scoring calendar year, compared to the rest of their careers, in terms of z-score
       Name                    CareerYrs   CareerRuns   Avg. ± SD     BestYr   BestYrRuns      z
1.     CK Nayudu                      41       11,825    288 ± 346      1932        1,893   4.64
2.     B Sutcliffe                    25       17,447    698 ± 723      1949        3,493   3.87
3.     FMM Worrell                    22       15,025    683 ± 792      1950        3,738   3.86
4.     Mansoor Akhtar                 23       13,804    600 ± 494      1987        2,328   3.50
5.     Saleem Malik                   22       16,586    754 ± 555      1991        2,693   3.49
6.     J Ryder                        21       10,501    500 ± 514      1921        2,247   3.40
7.     BC Lara                        20       22,156   1108 ± 811      1994        3,828   3.35
8.     MH Mankad                      29       11,593    400 ± 300      1946        1,402   3.34
9.     ED Weekes                      19       12,010    632 ± 641      1950        2,749   3.30
10.    RF Pienaar                     21       10,896    519 ± 468      1989        2,061   3.29
11.    KD Mackay                      19       10,823    570 ± 459      1956        2,079   3.29
12.    VM Merchant                    21       13,470    641 ± 790      1946        3,224   3.27
13.    DP Hughes                      23       10,419    453 ± 270      1982        1,303   3.15
14.    JC Adams                       18       11,234    624 ± 569      1994        2,375   3.08
15.    P Roy                          22       11,868    539 ± 470      1959        1,979   3.06
16.    RN Harvey                      18       21,699   1206 ± 753      1953        3,506   3.06
17.    A Shrewsbury                   27       26,505    982 ± 505      1887        2,520   3.05
18.    RG Pollock                     28       20,940    748 ± 338      1965        1,757   2.98
19.    AW Nourse                      30       14,216    474 ± 538      1924        2,076   2.98
20.    HW Taylor                      23       13,105    570 ± 501      1924        2,042   2.94
...
56.    VT Trumper                     19       16,939    892 ± 879      1902        3,220   2.65
...
68.    SJ Cook                        24       21,143    881 ± 913      1991        3,234   2.58
...
81.    DCS Compton                    22       38,942   1770 ± 1272     1947        4,962   2.51
82.    AR Morris                      14       12,614    901 ± 896      1948        3,149   2.51
...
87.    GA Hick                        26       41,112   1581 ± 791      1988        3,540   2.48
88.    DG Bradman                     20       28,067   1403 ± 1202     1930        4,368   2.47
...
125.   IT Botham                      20       19,399    970 ± 469      1982        2,056   2.32
...
145.   WG Grace                       44       54,211   1232 ± 669      1871        2,739   2.25
...
156.   SM Gavaskar                    22       25,834   1174 ± 771      1971        2,890   2.23
...
171.   H Sutcliffe                    22       50,670   2303 ± 941      1932        4,373   2.20
...
204.   FE Woolley                     29       58,959   2033 ± 638      1929        3,389   2.13
...
239.   GA Gooch                       26       44,846   1725 ± 871      1990        3,523   2.07
...
359.   MEK Hussey                     16       19,242   1203 ± 798      2001        2,711   1.89
...
369.   ME Trescothick                 17       16,645    979 ± 447      2009        1,817   1.87
...
402.   WH Ponsford                    14       13,819    987 ± 727      1930        2,311   1.82
...
410.   GS Sobers                      22       28,314   1287 ± 804      1968        2,745   1.81
...
462.   G Boycott                      25       48,426   1937 ± 674      1970        3,109   1.74
...
479.   IVA Richards                   22       36,212   1646 ± 833      1976        3,080   1.72
...
514.   WR Hammond                     26       50,551   1944 ± 1468     1933        4,422   1.69
...
576.   L Hutton                       19       40,140   2113 ± 1275     1948        4,167   1.61
...
581.   DJ Hussey                       7       10,048   1435 ± 803      2007        2,722   1.60
...
609.   KS Ranjitsinhji                15       24,692   1646 ± 1044     1899        3,284   1.57
...
704.   JB Hobbs                       26       61,760   2375 ± 798      1914        3,524   1.44
...
819.   KP Pietersen                   12       11,026    919 ± 564      2004        1,567   1.15
820.   FC Holland                     15       10,384    692 ± 381      1903        1,129   1.15
821.   W Bates                        11       10,249    932 ± 440      1885        1,433   1.14
822.   E Cooper                       10       13,304   1330 ± 515      1949        1,916   1.14
823.   AJW Croom                      18       17,692    983 ± 529      1931        1,584   1.14
824.   HE Dollery                     17       24,414   1436 ± 576      1949        2,084   1.13
825.   KL Hutchings                   11       10,054    914 ± 744      1908        1,744   1.12
826.   B Lilley                       15       10,496    700 ± 338      1928        1,074   1.11
827.   RDB Croft                      21       12,365    562 ± 216      1995          801   1.10
828.   MS Nichols                     16       17,823   1114 ± 501      1933        1,661   1.09
829.   HW Stephenson                  17       13,195    776 ± 336      1953        1,143   1.09
830.   SA Marsh                       18       10,098    561 ± 322      1990          911   1.09
831.   R Kilner                       13       14,707   1131 ± 420      1913        1,586   1.08
832.   G Barker                       18       22,286   1238 ± 468      1960        1,741   1.07
833.   JT Brown                       16       17,920   1120 ± 707      1896        1,873   1.07
834.   D Brookes                      21       30,874   1470 ± 720      1952        2,229   1.05
835.   A Hamer                        12       15,465   1289 ± 575      1959        1,850   0.98
836.   LTA Bates                      19       19,380   1020 ± 511      1926        1,518   0.97
837.   C Lee                          13       12,129    933 ± 601      1962        1,503   0.95
838.   A Young                        15       13,159    877 ± 390      1930        1,219   0.88

figures correct at end of English FC season 2009; full list available here
CK Nayudu's place at the top of this list is easily explained: for the majority of his career (a lengthy one: he played his last FC match aged 68!), Nayudu played a handful of games per year in India, amassing no more than a few hundred runs each time. Then, in 1932, he took part in India's inaugural test tour of the British Isles (during which he had the honour of captaining them in their first test match). That year, he played 55 FC innings, accumulating almost 2,000 runs. This single year is completely inconsistent with Nayudu's otherwise gentle career (it would be even more incongruous if he had not returned to England four years later, picking up just over 1,000 runs along the way).
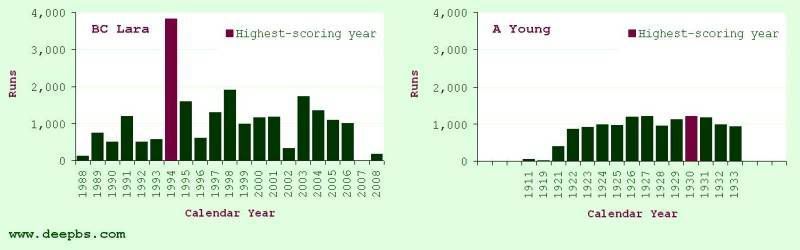
Not far below Nayudu, we find Brian Lara's astonishing 1994 (the year during which, most memorably, he broke the records for both test and FC high-scores). Altogether, that year, he amassed almost 4,000 runs and, though the rest of his career was hardly a bust, that aggregate is more than twice as many as he managed in any other calendar year.
The player at the bottom of the list happens to be a Somerset player: "Tom" Young. Once he had established himself in the side of the 1920s, his season's aggregate was always very close to 1,000 runs so, when he recorded his personal best of 1,219 in 1930, it was the least exceptional best year of any collected here.
Figure 1: BC Lara and A Young – first-class runs per calendar year
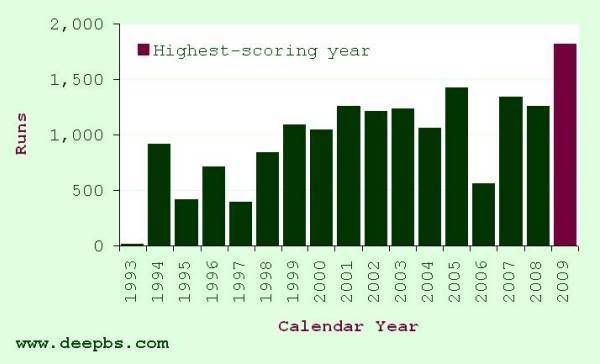
So what about Trescothick? His 2009 is in the top half of the list, but there's nothing too remarkable about it. It is quite obvious that, impressive though it was, his best year does not share the sore-thumb status we saw in Lara's record.
Figure 2: ME Trescothick – first-class runs per calendar year
If we make one key assumption about batsmen's calendar-year aggregates (that they are normally distributed – which, by and large, they appear to be), we can quantify just how unexpected it was. A z-score of 1.87 corresponds to a probability of 0.969 (see here for an online calculator). In turn, this means that – in a career like Trescothick's, with a mean year's aggregate of 979 ± 447 – we would expect a batsman to score 1,817 runs or more one year in every [1/(1-p)=] 33 he played, as a result of simple random variation (i.e. even if his opportunities to accumulate runs – as well as his ability to score them – had remained constant over time). If Nayudu's career had followed a consistent course (without incongruous trips abroad), we would have expected one year like his 1932 every 575,753 years!
So Trescothick's 2009 falls into the category of good but not stand-out exceptional. To the extent that it fails to confirm our hypothesis about his apparently extraordinary year, this is a disappointing finding. On the other hand, it is arguably to Trescothick's credit: after all, it is only possible to set a conspicuous high-water mark if it stands in contrast to a typically lower level of achievement.
Indian summers
The next development came, once more, as a result of a comment from Loyal of Lhasa. He said,
I thought it interesting that Trescothick had probably taken rather a long time to get to [his best season], for he was hardly a speedy starter....
So I rejigged the stats, to see how far into each player's career his best calendar year came. The table below shows how many years each batsman had been playing for – BestYrNo – when he compiled the largest aggregate of his career (this is a count of years in which the player in question actually played FC cricket so, e.g., anyone whose career straddled a war does not have those years added to his total). As before, the dataset is limited to those amassing at least 10,000 FC runs.
Table 3: How late in his career each batsman's highest-scoring calendar year came
       Name                    CareerYrs   CareerRuns   BestYr   BestYrRuns   BestYrNo
   1.  HTW Hardinge                   28       33,519     1928        2,446         23
  =2.  EM Grace                       33       10,025     1883          638         22
  =2.  JA Newman                      24       15,364     1928        1,773         22
  =4.  R Abel                         24       33,128     1901        3,309         21
  =4.  JH Board                       25       15,674     1911        1,184         21
  =4.  GAR Lock                       26       10,342     1966          831         21
  =7.  CP Mead                        28       55,061     1928        3,745         20
  =7.  FE Woolley                     29       58,959     1929        3,389         20
  =7.  CA Milton                      27       32,150     1967        2,089         20
  =7.  JC Balderstone                 24       19,034     1982        1,482         20
  =7.  SJ Cook                        24       21,143     1991        3,234         20
 =12.  S Coe                          24       17,438     1914        1,258         19
 =12.  AW Nourse                      30       14,216     1924        2,076         19
 =12.  A Ducat                        20       23,373     1930        2,067         19
 =12.  B Mitchell                     22       11,395     1947        2,243         19
 =12.  DR Turner                      24       19,005     1984        1,365         19
 =12.  AR Butcher                     22       22,667     1990        2,116         19
 =18.  PF Warner                      26       29,028     1911        2,274         18
 =18.  FA Pearson                     23       18,734     1921        1,498         18
 =18.  JR Freeman                     20       14,602     1926        1,958         18
 =18.  WRD Payton                     23       22,132     1926        1,864         18
 =18.  AS Kennedy                     26       16,586     1928        1,437         18
 =18.  Imtiaz Ahmed                   24       10,393     1962        1,646         18
 =18.  EJ Barlow                      25       18,212     1976        1,965         18
 =18.  JH Hampshire                   24       28,059     1978        2,105         18
 =18.  P Willey                       26       24,361     1983        2,036         18
 =18.  M Amarnath                     24       13,747     1983        1,620         18
 =18.  GA Gooch                       26       44,846     1990        3,523         18
 =18.  AJ Stewart                     23       26,165     1998        1,986         18
 =18.  SC Ganguly                     19       14,933     2007        1,391         18
 =31.  J Vine                         23       25,171     1912        1,887         17
 =31.  EJ Smith                       22       16,997     1925        1,477         17
 =31.  WE Astill                      30       22,735     1926        2,218         17
 =31.  JWH Makepeace                  21       25,799     1926        2,340         17
 =31.  EH Hendren                     27       57,611     1928        4,024         17
 =31.  AE Dipper                      21       28,075     1928        2,365         17
 =31.  CK Nayudu                      41       11,825     1932        1,893         17
 =31.  VM Merchant                    21       13,470     1946        3,224         17
 =31.  RWV Robins                     25       13,884     1946        1,397         17
 =31.  GO Dawkes                      18       11,411     1960          964         17
 =31.  B Constable                    20       18,849     1961        1,799         17
 =31.  MH Denness                     22       25,886     1975        1,904         17
 =31.  RW Taylor                      27       12,065     1976          837         17
 =31.  JA Ormrod                      24       23,206     1978        1,535         17
 =31.  BF Davison                     21       27,453     1983        2,341         17
 =31.  P Carrick                      22       10,300     1988          815         17
 =31.  NE Briers                      22       18,726     1990        1,996         17
 =31.  HP Tillakaratne                22       13,258     2001        1,554         17
 =31.  S Chanderpaul                  18       17,569     2008        1,709         17
 =31.  ME Trescothick                 17       16,645     2009        1,817         17
       ...
 =51.  GS Sobers                      22       28,314     1968        2,745         16
       ...
=109.  H Sutcliffe                    22       50,670     1932        4,373         14
       ...
=109.  WR Hammond                     26       50,551     1933        4,422         14
       ...
=272.  DB Close                       35       34,994     1959        1,990         11
       ...
=340.  JB Hobbs                       26       61,760     1914        3,524         10
       ...
=340.  WH Ponsford                    14       13,819     1930        2,311         10
       ...
=340.  L Hutton                       19       40,140     1948        4,167         10
       ...
=423.  G Boycott                      25       48,426     1970        3,109          9
       ...
=514.  DCS Compton                    22       38,942     1947        4,962          8
       ...
=514.  RN Harvey                      18       21,699     1953        3,506          8
       ...
=514.  MEK Hussey                     16       19,242     2001        2,711          8
       ...
=597.  WG Grace                       44       54,211     1871        2,739          7
       ...
=597.  VT Trumper                     19       16,939     1902        3,220          7
       ...
=597.  BC Lara                        20       22,156     1994        3,828          7
       ...
=687.  GA Hick                        26       41,112     1988        3,540          6
       ...
=746.  IVA Richards                   22       36,212     1976        3,080          5
       ...
=746.  SR Waugh                       21       24,052     1988        2,071          5
       ...
=795.  DG Bradman                     20       28,067     1930        4,368          4
       ...
=820.  EW Dillon                      15       11,006     1902        1,655          3
=820.  R Kilner                       13       14,707     1913        1,586          3
=820.  TC Dodds                       17       19,407     1947        2,147          3
=820.  WGA Parkhouse                  17       23,508     1950        2,284          3
=820.  FA Lowson                      10       15,321     1951        2,373          3
=820.  RG Broadbent                   14       12,800     1952        1,556          3
=820.  AA Baig                        20       12,367     1959        1,890          3
=820.  JM Parker                      14       11,254     1973        1,847          3
=820.  DW Hookes                      17       12,671     1977        1,634          3
=820.  BA Edgar                       15       11,304     1978        1,392          3
=820.  RJ Blakey                      19       14,674     1987        1,456          3
=820.  UC Hathurusingha               16       10,862     1991        1,325          3
=820.  ML Hayden                      19       24,603     1993        2,760          3
=820.  DR Martyn                      16       14,630     1993        1,617          3
=834.  GHG Doggart                    14       10,054     1949        2,063          2
=834.  AJ Moles                       12       15,305     1987        2,238          2
=834.  DP Ostler                      14       10,856     1991        1,284          2
=834.  AD Brown                       18       15,806     1993        1,382          2
=834.  A Symonds                      16       14,477     1995        1,724          2

figures correct at end of English FC season 2009; full list available here
Trescothick is, indeed, one of the higher entries, in equal thirty-first place out of 838, amongst those who waited until their 17th year to post their highest aggregate. There are some good players who took even longer, though, including Bobby Abel, Frank Woolley, Arthur Milton, Graham Gooch, and Alec Stewart. Another of Somerset's star openers, Jimmy Cook, is in the upper reaches the list, due to the obvious circumstances of his career.
At the very top of the list is one of Kent's greatest runscorers (and one of Tottenham Hotspur's shortest-lived managers), Wally Hardinge. He first appeared for Kent in 1902 and, from 1911 to 1931, never failed to pass 1,000 runs per summer for them. However, it wasn't until 1928 – the 23rd of his 28 years playing FC cricket – that he reached his zenith, with 2,446 runs at 59.65, including the highest score of his FC career, 263* v. a pretty strong Gloucestershire attack.
It seems that good batsmen very seldom give up when their runscoring powers are in the ascendancy. Amongst the 10,000 club, there's only one player who stopped playing immediately after his highest-scoring year, and that's Derbyshire stalwart Alan Hill. Like Hardinge, his best season also included his highest FC innings, 172* v. Yorkshire at Sheffield.
At the bottom of the list, it turns out that no one who has gone on to rack up 10,000 FC runs has failed to surpass his debut year, but there are a few who never got past their sophomore effort. For some reason, this group appears to have a strong association with Birmingham.
Getting better all the time?
So much for viewing Trescothick's 2009 as a one-off burst of brilliance; what about the alternative view that it was merely the latest manifestation of an inexorable rise? Looking back at figure 2, it appears to be the case that his runscoring capacity has increased over the course of his career. But can we do something a bit more informative than eyeballing an apparent trend?
To anyone with a bit of stats about them, the answer is pretty obvious. We have two variables – years and year-by-year aggregates – and we want to know the extent to which one predicts the other: how much is the passage of time reflected in a batsman's year-end aggregates? The most common way of estimating this is to calculate a value that is sometimes called the coefficient of determination, but is more commonly known as r2. This figure estimates the amount of variation in one variable that is explained by the other; the higher the r2, the closer the correlation. If a batsman's totals went up (or down) by exactly the same amount every year, then his r2 would be 1: 100% of the variance in the observed aggregates is explained by the year-on-year trend. If, on the other hand, there were absolutely no evidence of a (linear) relationship between calendar year aggregates and time, then r2 would be 0.
The next table shows this value for the set of batsmen with 10,000 FC runs, including all those with an r2 of 0.5 or higher (indicating a reasonably clear correlation between time and runs). Note that, at this stage, we do not care whether the association is a positive or a negative one; for now, we are only seeking to identify the batsmen with the most consistent trends to their careers, regardless of whether they were getting better or worse.
Table 4: Batsmen with consistent trends in calendar-year aggregates, sorted by r2
     Name              CareerYrs   Debut       M       I        R     Ave      r2
  1. WW Whysall               16    1910     371     601   21,592   38.76   0.939
  2. A Flower                 20    1986     223     372   16,379   54.06   0.797
  3. JA Rudolph               13    1997     160     272   11,371   44.77   0.789
  4. CJL Rogers               12    1998     149     263   12,865   52.30   0.781
  5. M van Jaarsveld          16    1994     222     373   15,587   45.98   0.765
  6. W Bates                  11    1877     299     495   10,249   21.58   0.764
  7. FA Lowson                10    1949     277     449   15,321   37.19   0.755
  8. AG Prince                15    1995     166     265   10,204   44.75   0.739
  9. EJ Smith                 22    1904     496     814   16,997   22.39   0.712
 10. G Dews                   16    1946     376     642   16,803   28.53   0.704
 11. TT Samaraweera           15    1995     207     285   11,233   48.00   0.674
 12. JF Parker                15    1932     340     523   14,272   31.58   0.654
 13. WE Bates                 18    1907     406     684   15,964   24.41   0.652
 14. WN Slack                 12    1977     237     398   13,950   38.97   0.637
 15. HFT Buse                 17    1929     304     523   10,623   22.70   0.634
 16. GE Tribe                 14    1945     308     454   10,177   27.36   0.629
 17. CS Elliott               14    1932     275     468   11,965   27.26   0.616
 18. JC Balderstone           24    1961     390     619   19,034   34.11   0.605
 19. AC Smith                 18    1958     428     612   11,027   20.92   0.602
 20. CC Inman                 15    1956     255     422   13,113   34.51   0.595
 21. C Charlesworth           20    1898     372     632   14,289   23.62   0.571
 22. KS Duleepsinhji           9    1924     205     333   15,485   49.95   0.552
 23. ME Trescothick           17    1993     254     438   16,645   40.11   0.549
 24. TH Clark                 13    1947     263     426   11,490   29.39   0.544
 25. AJ Strauss               12    1998     181     321   13,090   42.92   0.543
 26. MJ Di Venuto             18    1992     298     528   22,751   46.43   0.539
 27. A Young                  15    1911     311     539   13,159   25.45   0.539
 28. H Morris                 17    1981     314     544   19,785   40.30   0.532
 29. JA Jameson               17    1960     361     611   18,941   33.35   0.528
 30. MS Nichols               16    1924     483     756   17,823   26.56   0.525
 31. GHG Doggart              14    1948     210     347   10,054   31.52   0.521
 32. JL Hopwood               15    1923     400     575   15,548   29.90   0.512
 33. HE Dollery               17    1933     436     717   24,414   37.50   0.508
 34. N Pothas                 17    1993     201     310   10,604   42.25   0.501
     ...
 96. KP Pietersen             12    1998     140     233   11,026   50.81   0.322
     ...
169. GS Sobers                22    1953     383     609   28,314   54.87   0.225
     ...
204. SJ Cook                  24    1972     270     475   21,143   50.46   0.183
     ...
253. DCS Compton              22    1936     515     839   38,942   51.85   0.146
     ...
283. GA Hick                  26    1983     526     871   41,112   52.24   0.126
     ...
302. FE Woolley               29    1906     978   1,530   58,959   40.77   0.115
     ...
307. WH Ponsford              14    1921     162     235   13,819   65.18   0.114
     ...
361. SM Gavaskar              22    1966     348     563   25,834   51.36   0.087
     ...
389. IVA Richards             22    1972     507     796   36,212   49.40   0.075
     ...
395. MEK Hussey               16    1994     225     401   19,242   53.30   0.073
     ...
451. WG Grace                 44    1865     868   1,478   54,211   39.45   0.056
     ...
495. GA Gooch                 26    1973     580     990   44,846   48.85   0.043
     ...
510. JB Hobbs                 26    1905     832   1,325   61,760   50.66   0.038
     ...
521. DG Bradman               20    1927     232     338   28,067   95.14   0.036
     ...
528. IT Botham                20    1974     401     617   19,399   33.97   0.035
     ...
571. H Sutcliffe              22    1919     754   1,098   50,670   52.02   0.026
     ...
594. AR Morris                14    1940     162     250   12,614   53.68   0.022
     ...
630. DJ Hussey                 7    2003     132     203   10,048   55.21   0.015
     ...
669. L Hutton                 19    1934     513     814   40,140   55.29   0.009
     ...
674. G Boycott                25    1962     609   1,014   48,426   56.77   0.009
     ...
679. KS Ranjitsinhji          15    1893     307     500   24,692   56.37   0.008
     ...
736. CK Nayudu                41    1916     207     344   11,825   35.94   0.004
     ...
759. BC Lara                  20    1988     261     440   22,156   51.89   0.002
     ...
778. VT Trumper               19    1895     255     401   16,939   44.58   0.001
     ...
791. WR Hammond               26    1920     634   1,005   50,551   56.04   0.001
     ...
827. FMM Worrell              22    1942     207     326   15,025   54.24   0.000

figures correct at end of English FC season 2009; full list available here
As predicted, Trescothick is amongst those with the most obvious trends to their careers: an r2 of 0.549 is suggestive of a fairly clear correlation between time and runs, with over half of the variance in Trescothick's year-end aggregates explained by his year-on-year improvement.
The player at the top of this list is Nottinghamshire's leading runscorer of the 1920s, William "Dodger" Whysall. Whysall's Wisden obituary notes that he "matured slowly as a cricketer", which rather underplays the way in which he very gradually but very assuredly developed from a fairly ordinary performer into his county's most reliable batsman. Below, his year-by-year aggregates are plotted, with a regression line indicating the trend (ordinary least squares linear regression).
Figure 3: WW Whysall – first-class runs per calendar year, with fitted regression line
If you're wondering why his career came to an end despite showing such an encouraging trend, the sad answer is that Whysall died in late 1930. Alongside his status as the most consistently improving batsman in the record-books, he is probably also the only player to die of complications of an injury sustained on the dancefloor.
The figure below shows scatterplots for the batsmen at nos. 2–5 on the list. It is no surprise to see several current players, here: obviously, to begin a career with a positive trend is a more easily achievable feat than it is to sustain a year-on-year improvement from the beginning to the end of one's time in the game.
Figure 4: First-class runs per calendar year, with fitted regression lines, for selected batsmen

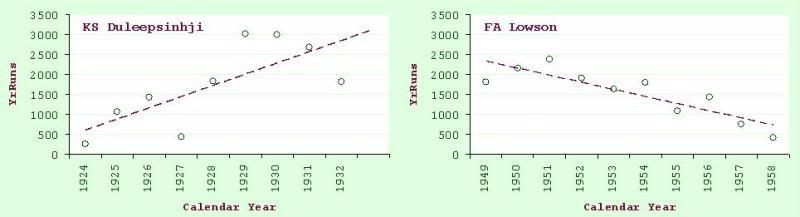
Because all the plots have been standardised to the same scale, the extent of year-on-year improvement can be seen in the gradient of the regression lines (the steeper the line, the more dramatic the improvement). So, of the four players whose career trends are pictured, Chris Rogers's career to date has shown the most meteoric rise, whereas Andy Flower's improvement was more gradual and sustained. This immediately suggests another question: whose career has shown the greatest year-on-year increase (i.e. who has the steepest regression line)? Before asking this, it is necessary to limit the dataset to those players for whom we can be reasonably confident that there is some sort of trend there at all. A straightforward way to do this is to exclude all the observations for which the regression model did not estimate a significant gradient (conventionally, statisticians tend to set the threshold for significance at p≤0.05 – this is loosely equivalent to saying we'll accept 1 false-positive per 20 analyses we conduct, although the precise definition of a p-value is not quite as intuitive to non-statisticians). It turns out that 177 of our 838 batsmen meet this criterion.
Having assembled a set of players whose careers appear to follow some sort of trend, we can sort it according to our best estimate of the average number of runs by which each player's year-end aggregates went up (or down) each year (technically, this is the beta coefficient from the regression model). This value, marked YrOnYr in the table, provides the gradient of the slopes seen in the scatterplots. Note that negative values (indicating that the player's year-end aggregates showed a decreasing trend) are possible.
Table 5: Batsmen with the most consistently positive trends in calendar-year aggregates
     Name              CareerYrs   Debut       M       I        R     Ave      r2   YrOnYr (95%CI)                p
  1. KS Duleepsinhji           9    1924     205     333   15,485   49.95   0.552    280.5 (54.6, 506.4)      0.022
  2. CJL Rogers               12    1998     149     263   12,865   52.30   0.781    231.9 (145.5, 318.3)    <0.001
  3. WW Whysall               16    1910     371     601   21,592   38.76   0.939    190.8 (163.0, 218.7)    <0.001
  4. CF Walters               13    1923     245     427   12,145   30.75   0.492    157.8 (51.4, 264.2)      0.008
  5. WN Slack                 12    1977     237     398   13,950   38.97   0.637    155.7 (72.9, 238.5)      0.002
  6. JA Rudolph               13    1997     160     272   11,371   44.77   0.789    129.9 (85.3, 174.4)     <0.001
  7. CC Inman                 15    1956     255     422   13,113   34.51   0.595    124.0 (62.6, 185.3)      0.001
  8. W Bates                  11    1877     299     495   10,249   21.58   0.764    116.0 (67.3, 164.7)     <0.001
  9. M van Jaarsveld          16    1994     222     373   15,587   45.98   0.765    112.4 (76.6, 148.1)     <0.001
 10. CS Elliott               14    1932     275     468   11,965   27.26   0.616    111.7 (56.2, 167.2)      0.001
 11. TH Clark                 13    1947     263     426   11,490   29.39   0.544    110.7 (43.4, 178.0)      0.004
 12. LB Fishlock              16    1931     417     699   25,376   39.34   0.306    106.8 (14.5, 199.1)      0.026
 13. JF Parker                15    1932     340     523   14,272   31.58   0.654    105.2 (59.3, 151.1)     <0.001
 14. CL Smith                 14    1978     269     466   18,028   44.40   0.362    100.4 (16.6, 184.2)      0.023
 15. CAG Russell              19    1908     436     717   27,354   41.57   0.366    100.0 (32.7, 167.3)      0.006
 16. C Lee                    13    1952     271     472   12,129   26.60   0.415     99.5 (21.1, 177.9)      0.017
 17. H Morris                 17    1981     314     544   19,785   40.30   0.532     98.9 (47.8, 149.9)      0.001
 18. JA Jameson               17    1960     361     611   18,941   33.35   0.528     97.2 (46.6, 147.7)      0.001
 19. MJ Di Venuto             18    1992     298     528   22,751   46.43   0.539     97.1 (49.5, 144.8)      0.001
 20. G Dews                   16    1946     376     642   16,803   28.53   0.704     95.9 (60.2, 131.6)     <0.001
     ...
 26. A Flower                 20    1986     223     372   16,379   54.06   0.797     88.9 (66.6, 111.2)     <0.001
     ...
 57. ME Trescothick           17    1993     254     438   16,645   40.11   0.549     65.6 (32.9, 98.4)       0.001
     ...
 74. GS Sobers                22    1953     383     609   28,314   54.87   0.225     58.8 (7.9, 109.6)       0.026
     ...
 85. SJ Cook                  24    1972     270     475   21,143   50.46   0.183     55.2 (3.6, 106.8)       0.037
     ...
149. AP Lucas                 29    1874     256     435   10,263   26.38   0.187    -13.6 (-24.8, -2.4)      0.019
150. KJ Key                   26    1882     367     567   13,008   26.23   0.158    -21.2 (-41.9, -0.6)      0.044
151. FH Gillingham            22    1903     210     352   10,050   30.64   0.353    -25.6 (-41.8, -9.5)      0.004
152. FR Brown                 25    1930     355     536   13,325   27.36   0.174    -25.7 (-49.8, -1.5)      0.038
153. PA Perrin                29    1896     537     918   29,709   35.92   0.297    -26.0 (-41.9, -10.2)     0.002
154. DB Close                 35    1949     785   1,225   34,994   33.23   0.188    -26.2 (-45.6, -6.9)      0.009
155. Hanif Mohammad           25    1951     238     370   17,059   52.33   0.178    -29.0 (-55.9, -2.1)      0.036
156. KWR Fletcher             27    1962     730   1,167   37,665   37.78   0.192    -30.1 (-55.6, -4.7)      0.022
157. CP McGahey               24    1894     437     751   20,723   30.21   0.178    -30.8 (-60.2, -1.5)      0.040
158. AF Wensley               20    1922     399     595   10,875   20.48   0.212    -33.0 (-64.5, -1.5)      0.041
159. NH Fairbrother           20    1983     366     580   20,612   41.22   0.327    -33.7 (-57.6, -9.7)      0.008
160. JF Steele                17    1970     379     605   15,054   28.95   0.241    -41.2 (-81.5, -0.9)      0.046
161. AA Baig                  20    1955     235     391   12,367   34.07   0.235    -42.7 (-80.9, -4.5)      0.030
162. LH Tennyson              22    1913     477     759   16,828   23.34   0.397    -44.6 (-70.2, -19.0)     0.002
163. JP Stephenson            21    1985     303     512   14,773   32.40   0.258    -45.5 (-82.6, -8.4)      0.019
164. APF Chapman              20    1920     392     554   16,309   31.98   0.380    -48.5 (-79.1, -17.8)     0.004
165. AC Smith                 18    1958     428     612   11,027   20.92   0.602    -50.0 (-71.5, -28.4)    <0.001
166. FA Tarrant               24    1899     329     541   17,952   36.41   0.203    -50.6 (-95.0, -6.3)      0.027
167. KJ Hughes                17    1975     216     368   12,711   36.53   0.236    -52.3 (-104.1, -0.5)     0.048
168. PJ Watts                 18    1959     375     607   14,449   27.95   0.356    -53.7 (-91.9, -15.4)     0.009
169. TG Evans                 21    1939     465     753   14,882   21.23   0.388    -55.4 (-88.8, -22.0)     0.003
170. JR Mason                 22    1893     339     557   17,337   33.28   0.427    -57.7 (-88.9, -26.6)     0.001
171. ERT Holmes               22    1924     301     465   13,598   32.85   0.287    -57.8 (-100.2, -15.3)    0.010
172. RR Relf                  18    1905     302     529   14,522   28.42   0.304    -65.3 (-117.7, -12.9)    0.018
173. RES Wyatt                30    1923     737   1,141   39,405   40.05   0.378    -73.2 (-109.5, -36.8)   <0.001
174. LJ Lenham                14    1956     300     539   12,796   26.17   0.433    -83.2 (-143.0, -23.3)    0.010
175. AJ Moles                 12    1986     230     416   15,305   40.70   0.474    -89.7 (-156.2, -23.1)    0.013
176. GHG Doggart              14    1948     210     347   10,054   31.52   0.521   -101.7 (-163.0, -40.4)    0.004
177. FA Lowson                10    1949     277     449   15,321   37.19   0.755   -177.4 (-259.8, -95.0)    0.001

figures correct at end of English FC season 2009; full list available here
Several of the names at the head of this list are familiar from our previous analysis, but our leader is someone to whom we have not paid particular attention, as yet. Kumar Shri Duleepsinhji's career only spanned nine seasons, but that was long enough for him to rack up over 15,000 FC runs (including 50 centuries) at an average a hair under 50. Like his uncle, Ranji, he was also extremely successful in his few test matches in England colours. One reason why his career shows such a dramatic upward trend is that he was cut off just as he was reaching his peak. The innings that turned out to be his last in FC cricket was the 90 he made - we can assume, with his renowned elegance - at Taunton in 1932. Afterwards, he collapsed, and was forced to withdraw from England's forthcoming tour to Australia (which would, of course, be remembered for other reasons entirely). Ultimately, he was compelled to give the game up completely, on his doctors' orders. He was only 27 at the time.
At the other end of the spectrum, we find Frank Lowson, best known as Len Hutton's opening partner at Yorkshire in the last part of the great man's career. Lowson was in his thirties by the time he made his FC debut in 1949. His first three seasons were all extremely successful, culminating in selection for England in 1951, followed by a tour to the subcontinent that winter. Unhappily, he did not distinguish himself in his test outings, and his career began a slide that was never arrested until he bowed out, aged 43, in 1958. To be sure, amassing 10,000 FC runs is an achievement of which any batsman can be proud; nevertheless, amongst those to achieve this landmark, none had so steep a decline as Lowson, who scored an average of 177 fewer runs each year of his career.
Figure 5: First-class runs per calendar year, with fitted regression lines, for KS Duleepsinhji and FA Lowson
The apparent declines of two notable England captains – Brian Close and Bob Wyatt – need to be taken with a pinch of a salt. For almost a decade after his competitive career came to an end, Close had one FC outing per year, leading his own XI at the Scarborough festival. Similarly, Wyatt's career had a six-year coda, featuring very sporadic appearances for the MCC and – at a time when some of their fixtures attracted FC status – the Free Foresters. For each player, if analysis is confined to the competitive portion of their careers, the regression model no longer identifies a significant negative trend.
To conclude, we should return to the player who sparked off this line of enquiry in the first place. According to this analysis, Marcus Trescothick is what an American sportscaster might call the 57th improvingest batsman in FC history. He has tended to total 65.6 additional runs per year he has been in the game, which means that, if the linear trend is continued, we would expect him to amass 1,569 FC runs in 2010. Of course, Somerset's fans would be delighted if this trend – or something like it – extends for many more years to come.
Figure 6: ME Trescothick – first-class runs per calendar year, with fitted regression line





 Posts
Posts

