Showing posts with label tests. Show all posts

1 January 2010

Ploughing your own furrow or making hay?

Following discussion of the oft-repeated stat about Ian Bell never scoring 100 if no-one else has, Spaceman! of the TMSB Exiles wanted to know

... who has the best average when no-one else in the innings has scored a 50/100?

This is a really neat little question, with what I think are some quite revealing answers.

Table 1 shows the career records of batsmen in innings in which no-one (other than the batsman himself) made it to 50. For comparison, the remainder of each player's career (i.e. innings where at least one team-mate scored a half-century) is shown alongside, and the relative difference between batting averages in the two scenarios is given in the final column.

Table 1: Test batting records divided into innings in which no other batsmen made 50 and those in which at least one did

<--- no other batsman made 50 ---> <----- other batsmen made 50 -----> Name I NOs R Ave HS 50 100 I NOs R Ave HS 50 100 Diff% 1. BL D'Oliveira 14 5 614 68.22 114* 3 2 56 3 1,870 35.28 158 12 3 193.4% 2. SJ McCabe 13 4 594 66.00 189* 1 2 49 1 2,154 44.88 232 12 4 147.1% 3. DL Amiss 17 7 657 65.70 262* 2 1 71 3 2,955 43.46 203 9 10 151.2% 4. KS Ranjitsinhji 10 3 437 62.43 154* 2 1 16 1 552 36.80 175 4 1 169.6% 5. KF Barrington 29 7 1,314 59.73 132* 6 3 102 8 5,492 58.43 256 29 17 102.2% 6. DL Haynes 53 20 1,968 59.64 143 8 5 149 5 5,519 38.33 184 31 13 155.6% 7. JB Hobbs 21 6 893 59.53 126* 9 1 81 1 4,517 56.46 211 19 14 105.4% 8. AI Kallicharran 17 5 708 59.00 126 4 2 92 5 3,691 42.43 187 17 10 139.1% 9. Saleem Malik 24 8 927 57.94 99 8 0 130 14 4,841 41.73 237 21 15 138.8% 10. H Sutcliffe 17 5 676 56.33 135 2 2 67 4 3,879 61.57 194 21 14 91.5% 11. NCL O'Neill 15 6 505 56.11 134 2 1 54 2 2,274 43.73 181 13 5 128.3% 12. DM Jones 20 5 838 55.87 184* 3 2 69 6 2,793 44.33 216 11 9 126.0% 13. L Hutton 46 13 1,817 55.06 202* 10 3 92 2 5,154 57.27 364 23 16 96.1% 14. RA Smith 25 6 1,031 54.26 148* 6 3 87 9 3,205 41.09 175 22 6 132.1% 15. RC Fredericks 24 5 1,029 54.16 138 5 3 85 2 3,305 39.82 169 21 5 136.0% 16. GC Smith 24 4 1,053 52.65 154* 6 2 113 5 5,386 49.87 277 20 16 105.6% 17. KC Wessels 13 2 578 52.55 118 4 1 58 1 2,210 38.77 179 11 5 135.5% 18. TT Samaraweera 16 2 723 51.64 125 5 2 74 11 3,215 51.03 231 16 9 101.2% 19. HP Tillakaratne 27 8 981 51.63 119 4 3 104 17 3,564 40.97 204* 16 8 126.0% 20. BC Broad 10 2 409 51.13 139 0 2 34 0 1,252 36.82 162 6 4 138.8% 21. IVA Richards 31 4 1,378 51.04 130 11 3 151 8 7,162 50.08 291 34 21 101.9% ... 27. BC Lara 63 2 2,976 48.79 226 15 8 167 4 8,936 54.82 400* 33 26 89.0% 28. G Boycott 51 13 1,828 48.11 121* 12 3 142 10 6,286 47.62 246* 30 19 101.0% ... 31. JH Kallis 40 9 1,466 47.29 162 7 3 183 23 8,930 55.81 189* 45 29 84.7% ... 36. KP Pietersen 19 1 812 45.11 142 3 3 81 3 3,987 51.12 226 13 13 88.3% 37. DCS Compton 36 7 1,308 45.10 158 7 3 95 8 4,499 51.71 278 21 14 87.2% ... 46. DG Bradman 13 2 485 44.09 131 1 3 67 8 6,511 110.36 334 12 26 40.0% ... 54. WR Hammond 31 5 1,095 42.12 113 4 1 109 11 6,154 62.80 336* 20 21 67.1% ... 66. V Sehwag 26 3 939 40.83 195 4 2 95 1 5,226 55.60 319 14 15 73.4% ... 73. GA Headley 17 1 631 39.44 107 3 2 23 3 1,559 77.95 270* 2 8 50.6% 74. AJ Strauss 28 5 905 39.35 128 4 2 98 0 4,462 45.53 177 14 16 86.4% ... 77. SR Tendulkar 52 5 1,837 39.09 122 9 5 213 23 11,133 58.59 248* 45 38 66.7% ... 79. SR Waugh 50 11 1,520 38.97 122* 7 3 210 35 9,407 53.75 200 43 29 72.5% ... 84. RS Dravid 49 13 1,387 38.53 118 8 1 186 14 9,846 57.24 270 50 27 67.3% ... 106. AC Gilchrist 16 2 516 36.86 144 2 1 119 18 4,959 49.10 204* 23 16 75.1% ... 109. RT Ponting 31 4 991 36.70 156 5 2 201 22 10,434 58.29 257 44 36 63.0% ... 115. AR Border 60 12 1,734 36.13 163 8 4 205 32 9,440 54.57 205 55 23 66.2% ... 122. GS Sobers 27 2 893 35.72 168 3 2 133 19 7,139 62.62 365* 27 24 57.0% ... 139. Yousuf Youhana 30 0 1,027 34.23 115 5 3 116 12 6,220 59.81 223 26 21 57.2% ... 195. IR Bell 15 2 385 29.62 83 3 0 76 7 2,906 42.12 199 18 9 70.3% ... 252. VT Trumper 29 2 704 26.07 159 2 1 60 6 2,459 45.54 214* 11 7 57.3% ... 298. PD Collingwood 13 2 251 22.82 74 1 0 83 8 3,481 46.41 206 17 9 49.2% ... 387. KR Miller 20 3 288 16.94 61 1 0 67 4 2,670 42.38 147 12 7 40.0% ... 483. RA Woolmer 10 2 73 9.13 19* 0 0 24 0 986 41.08 149 2 3 22.2% ... 487. LEG Ames 11 1 90 9.00 17* 0 0 61 11 2,344 46.88 149 7 8 19.2% ... 538. BS Chandrasekhar 14 7 20 2.86 6 0 0 66 32 147 4.32 22 0 0 66.1% 539. HK Olonga 10 1 19 2.11 5 0 0 35 10 165 6.60 24 0 0 32.0% 540. TM Alderman 13 6 10 1.43 4 0 0 40 16 193 8.04 26* 0 0 17.8% 541. CS Martin 17 6 6 0.55 4* 0 0 59 34 77 3.08 12* 0 0 17.7% qual. 10 innings in which no 50 was scored by other players; full list available here

The batsmen at the top of this list are those who scored most heavily when their team-mates went missing. Consequently, it is interesting to see a good proportion of individuals who are known for backs-to-the-wall grit amongst them, including McCabe, Barrington, Dean Jones, and Graeme Smith. By and large, the highest ranked players fall into one of two categories: those who consistently averaged well, regardless of what was going on around them (Barrington, Hobbs, Sutcliffe, Hutton), and those who appear to have raised their performance when their team-mates were doing less well. Our leader, Basil D'Oliveira, is the most conspicuous example of the latter: his average in innings in which the other ten failed to reach fifty is very nearly twice what he achieved when team-mates passed that landmark.

Perhaps the most notable feature of this analysis, though, is that it doesn't have a certain, familiar name at the top; indeed, it arguably does not reflect especially well on Bradman at all. When you spend as much time staring at cricket statistics as I do, you end up looking at Donald Bradman's record very closely indeed. This is the first time I have seen anything approaching objective evidence to corroborate the fairly pervasive anecdotal view that Bradman may have fallen short of his usual superhuman standards when circumstances were most hostile for batsmen. If we interpret the absence of 50-plus scores as a proxy for the presence of such conditions, perhaps it is significant that there are 45 test batsmen who have outperformed Bradman in those innings.

Mind you, if we're raising an eyebrow at the Don, we probably have to wag a finger at the Nugget. Keith Miller's record in innings in which none of his team-mates passed 50 is conspicuously dreadful. Only one of his 12 50s and none of his seven centuries came in such knocks, with the result that his stats have the appearance of a batsman who was most at home making hay while the sun shone (maybe he was just so damned sociable that he couldn't bear to make runs on his own).

It is also a bit surprising to note the terrible records of a couple of Ashes-winning Kent stalwarts. Neither Les Ames nor Bob Woolmer once passed 50 unless at least one of their team-mates had also registered a half-century; in fact, neither of them ever scored as much as 20 in such innings.

In contrast to the kinks in the middle of the table, it's reassuring to see things return to form at the bottom end. Poor old Chris Martin is as far adrift as ever: when no-one around – let's face it, above – him has made it to 50, he can only be expected to score a run every other innings.

Table 2 shows exactly the same kind of analysis but, this time, the threshold is the magical three figures.

Table 2: Test batting records divided into innings in which no other batsmen made 100 and those in which at least one did

<--- no other batsman made 100 ---> <----- other batsmen made 100 ----> Name I NOs R Ave HS 50 100 I NOs R Ave HS 50 100 Diff% 1. J Ryder 15 4 843 76.64 201* 5 2 17 1 551 34.44 112 4 1 222.5% 2. DG Bradman 44 5 2,860 73.33 334 7 11 36 5 4,136 133.42 304 6 18 55.0% 3. VG Kambli 13 1 843 70.25 227 0 4 8 0 241 30.13 82 3 0 233.2% 4. CAG Russell 13 2 708 64.36 140 0 5 5 0 202 40.40 96 2 0 159.3% 5. KS Duleepsinhji 10 2 484 60.50 173 2 1 9 0 511 56.78 117 3 2 106.6% 6. CP Mead 16 2 838 59.86 182* 2 3 10 0 347 34.70 102 1 1 172.5% 7. A Melville 10 2 475 59.38 117 1 3 9 0 419 46.56 189 2 1 127.5% 8. WR Hammond 90 13 4,569 59.34 336* 18 11 50 3 2,680 57.02 227 6 11 104.1% 9. JB Hobbs 68 7 3,518 57.67 187 21 9 34 0 1,892 55.65 211 7 6 103.6% 10. SJ McCabe 34 5 1,661 57.28 232 7 4 28 0 1,087 38.82 149 6 2 147.5% 11. RG Pollock 26 3 1,310 56.96 209 7 5 15 1 946 67.57 274 4 2 84.3% 12. JDB Robertson 15 2 729 56.08 133 6 2 6 0 152 25.33 44 0 0 221.4% 13. H Sutcliffe 51 8 2,400 55.81 161 13 7 33 1 2,155 67.34 194 10 9 82.9% 14. IVA Richards 112 10 5,661 55.50 291 25 17 70 2 2,879 42.34 178 20 7 131.1% 15. GA Headley 34 3 1,714 55.29 270* 4 7 6 1 476 95.20 169* 1 3 58.1% 16. KC Sangakkara 89 8 4,474 55.23 232 15 13 58 2 3,075 54.91 287 17 8 100.6% 17. KC Bland 27 4 1,263 54.91 144* 6 3 12 1 406 36.91 78 3 0 148.8% 18. CL Walcott 46 5 2,216 54.05 220 10 8 28 2 1,582 60.85 152 4 7 88.8% 19. EAB Rowan 38 5 1,760 53.33 236 11 3 12 0 205 17.08 67 1 0 312.2% 20. SR Watson 12 1 584 53.09 120* 4 1 9 0 236 26.22 53 2 0 202.5% 21. DR Jardine 17 3 740 52.86 127 7 1 16 3 556 42.77 98 3 0 123.6% 22. KF Barrington 87 10 4,035 52.40 151* 20 11 44 5 2,771 71.05 256 15 9 73.8% 23. L Hutton 93 14 4,102 51.92 205 21 10 45 1 2,869 65.20 364 12 9 79.6% 24. G Boycott 136 22 5,907 51.82 191 28 18 57 1 2,207 39.41 246* 14 4 131.5% 25. Yousuf Youhana 87 7 4,126 51.58 202 20 13 59 5 3,121 57.80 223 11 11 89.2% 26. RT Ponting 121 19 5,260 51.57 242 20 17 111 7 6,165 59.28 257 29 21 87.0% ... 40. GS Sobers 95 12 4,036 48.63 198 17 11 65 9 3,996 71.36 365* 13 15 68.1% ... 43. BC Lara 177 5 8,349 48.54 375 32 25 53 1 3,563 68.52 400* 16 9 70.8% ... 46. KP Pietersen 61 2 2,830 47.97 158 10 10 39 2 1,969 53.22 226 6 6 90.1% ... 52. JH Kallis 144 21 5,788 47.06 189* 33 13 79 11 4,608 67.76 186 19 19 69.4% ... 59. RS Dravid 148 22 5,873 46.61 270 31 9 87 5 5,360 65.37 233 27 19 71.3% ... 68. DT Lindsay 20 0 912 45.60 182 3 3 11 1 218 21.80 65 2 0 209.2% ... 71. ED Weekes 48 1 2,126 45.23 162 11 6 33 4 2,329 80.31 207 8 9 56.3% ... 84. GC Smith 80 9 3,152 44.39 154* 22 4 57 0 3,287 57.67 277 4 14 77.0% ... 91. V Sehwag 75 4 3,121 43.96 201* 10 8 46 0 3,044 66.17 319 8 9 66.4% 92. SR Tendulkar 166 17 6,544 43.92 248* 29 19 99 11 6,426 73.02 241* 25 24 60.1% 93. G Gambhir 27 3 1,051 43.79 167 5 2 21 0 1,502 71.52 206 5 6 61.2% 94. AJ Strauss 73 5 2,977 43.78 161 9 11 53 0 2,390 45.09 177 9 7 97.1% ... 146. VT Trumper 72 7 2,564 39.45 214* 9 7 17 1 599 37.44 135* 4 1 105.4% 147. PD Collingwood 53 7 1,813 39.41 135 11 3 43 3 1,919 47.98 206 7 6 82.2% ... 188. RA Woolmer 25 2 852 37.04 149 1 3 9 0 207 23.00 82 1 0 161.1% ... 211. AC Gilchrist 51 6 1,605 35.67 144 10 2 84 14 3,870 55.29 204* 15 15 64.5% ... 267. DW Randall 59 5 1,809 33.50 174 8 6 20 0 661 33.05 164 4 1 101.4% ... 336. IR Bell 49 3 1,400 30.43 97 14 0 42 6 1,891 52.53 199 7 9 57.9% ... 456. KR Miller 51 5 1,199 26.07 145* 3 2 36 2 1,759 51.74 147 10 5 50.4% ... 481. LEG Ames 40 5 892 25.49 126 4 1 32 7 1,542 61.68 149 3 7 41.3% ... 1140. JV Saunders 15 5 19 1.90 9 0 0 8 1 20 2.86 11* 0 0 66.5% 1141. M Mbangwa 20 7 24 1.85 8 0 0 5 1 10 2.50 5 0 0 73.8% 1142. CS Martin 58 31 46 1.70 7 0 0 18 9 37 4.11 12* 0 0 41.4% 1143. Mohammad Akram 11 3 11 1.38 5 0 0 4 3 13 13.00 10* 0 0 10.6% qual. 10 innings in which no 100 was scored by other players; full list available here

Although he is pipped to top spot by his first test skipper, Bradman's reputation might be restored somewhat by this analysis. It speaks volumes for his astonishing weight of runscoring that his unsupported average is the second-best in test history and is still only just over half as good as his performance when other batsmen got to three figures! On the opposite side of the coin, it is in keeping with Douglas Jardine's reputation as a batsman that his one test hundred and seven of his ten test fifties came in innings in which none of his team-mates had reached 100.

I love that Jack Hobbs is right near the top of the list (as he was in the 50s table), with a better record when he was going it alone than when his team-mates were joining in the fun. This finding is perfectly reflective of a quotation from Hobbs to which TMSB Exiles contributor rob.cricketpunk drew our attention in a related discussion. Speaking to John Arlott about batting for Surrey, Hobbs said,

If Sandy [Andy Sandham] was going well, we had plenty of batting to come and I would give one of my old bowler mates a chance; but if Sandy and Tom [Shepherd] and Andy [Ducat] got out, then I had to earn my money from Surrey and get some runs.

It also doesn't surprise me to find Viv Richards in the upper reaches, with quite a pronounced discrepancy between his unsupported and supported knocks. The fact that 17 of his 24 tons were achieved as sole centurion is characteristic of a man who loved to raise his game to meet an occasion.

So what about the man who sparked the whole debate off? Is it fair to get on Ian Bell's back for his apparently lopsided record? The defence has to plead guilty to the charge as it is commonly formulated: nobody in the history of test cricket has scored as many as Bell's nine centuries without ever being a lone centurion (Bill Woodfull is second with seven). Still, it's worth highlighting the extent to which, in terms of relative levels of performance between the two scenarios, Bell is far from the worst offender generally. He scores getting on for 60% as many runs in innings where no-one has reached three figures as he does when there is at least one centurion other than him, which puts him in the same ballpark as Weekes, Headley, Laxman, and Tendulkar, and a little way ahead of Miandad, Worrell, Dexter, and Miller. Although Bell has yet to be the only man to reach three-figures in a test innings, he has 14 half-centuries in innings in which no one passed 100 which, from 49 attempts, isn't terrible.

Moreover, when you look back at the innings in which no-one else passed 50 (which you have to think of as the most challenging circumstances of all – those in which Bell is supposed to be at his most inadequate), his record looks pretty okay. For example, we've all seen Bell's supposed mental frailty compared unfavourably to Paul Collingwood's supposed capacity for dogged resistance. Actually, Collingwood's record, in this area, is quite a lot worse. Of Collingwood's 27 test innings of 50 or more, there was one solitary occasion on which no-one else on the team registered at least a half-century (though, it has to be said, that was quite an important one), and his average of 22.82 in such innings is a fair bit worse than Bell's 29.62.

Ultimately, though, I remain to be convinced that any of this matters very much. It seems to me that successful teams need batsmen who can capitalise on good starts every bit as much as they need those whose heroics might rescue a parlous situation. The accepted wisdom is that the players who perform best when circumstances are least favourable are the most valuable; these are the kind of players we tend to call "matchwinners". But you'd never win any matches if you had to rely solely on batsmen who only turn it on when the spotlight is dialled up to sufficient wattage (I'm on record, elsewhere, advancing a similar argument in – slight – criticism of Viv Richards who, certainly over the later two-thirds of his career, was still capable of astonishing performances, but only tended to pull them out of the bag on a whim). After all, someone needs to score runs when they are most obviously there to be scored. So maybe we should stop repeating that stat about Ian Bell and start circulating a new one: England have never lost a test match in which he scored a century.


I feel obliged to offer a little postscript, here. Statistically speaking, I've done something deeply questionable, in these analyses. Assuming that apparent discrepancies between different subsets of batsmen's careers are meaningful on face value alone is pretty dumb. Actually, there is enough variation in all batsmen's records that, if you cut their record up into two random halves, you'd expect a good number of them to end up with two very different looking sets of performance. (David Barry gave a neat demonstration of this on his blog a little while ago.) This means that, even if all batsmen were equally good regardless of how well their team-mates got on in each of their innings, random variation alone would result in some of their records looking very different when you cut them up in the way I have, above. Distinguishing meaningful signal from random noise is at the heart of proper statistical analysis (it's what commonly gets labelled as identifying "statistical significance"), and it's really bad practice to stick up lists of numbers without doing anything of the sort. However, I'm not alone, in this respect: I'm not aware of anyone, ever, in the history of cricket stats taking this basic step. As it happens, I have (what I think are) some really good methods for beginning to make robust comparisons within and between batsmen's careers, but I'm unlikely to introduce them to this blog for a while, yet (partially because it'll take forever to write them up; partially because I'm kinda hoping to get them published in an academic journal, first). I just wanted to register the fact that all the above has a very good chance of being – like the vast majority of things presented as cricket statistics – absolute rubbish.

9 December 2009

... and the less said about the rest, the better

This is a quick trivia post in response to some queries raised by MiPiL on TMSB Exiles. He wanted to know

What's the lowest completed innings to contain
— 1 individual 100
— 1 individual 200
— 2 individual 100s?

To begin with, I assumed he was talking about test cricket. Altogether, there have been a dozen occasions on which an all-out test innings of less than 200 has included one individual three-figure score; details are given in Table 1.

The top two both took place at the same ground, albeit getting on for half a century apart. It wasn't all that unusual for the New Zealand side of the late 1950s and early 1960s to rely on John Reid to salvage a little respectability from some otherwise one-sided encounters, but this was never more dramatically the case than in the match identified here. Reid had top-scored in New Zealand's first innings, but his second-innings ton was even more isolated: despite Reid's score of exactly 100, the Kiwis were able to scrape together just 159, and the skipper was the only batsman to pass 22.

Note that the entry in sixth place on the list is a very recent one: as more experienced heads were lost around him, Adrian Barath – playing in his debut test match at the age of nineteen – was the only West Indian batsman to mount any resistance to the Australian bowlers during the first test of the current series, at Brisbane. If he can repeat the success of his very well received 104 (and the rest of the team can fail to replicate their less distinguished performances), the future of West Indies cricket may appear somewhat brighter than it has been painted, of late.

Table 1: Lowest all-out test innings to feature an individual century

Total Team Centurion Match 159 New Zealand JR Reid 2nd inns -v- England at Lancaster Park, Christchurch, 1962/63 170 Sri Lanka KC Sangakkara 2nd inns -v- New Zealand at Jade Stadium, Christchurch, 2006/07 177 South Africa JH Sinclair 1st inns -v- England at Newlands, Cape Town, 1898/99 182 South Africa HW Taylor 1st inns -v- England at Lord's, Durban, 1913/14 184 Australia MJ Slater 2nd inns -v- England at Sydney Cricket Ground, 1998/99 187 West Indies A Barath 2nd inns -v- Australia at Brisbane Cricket Ground, Woolloongabba, Brisbane, 2009/10 191 Australia DG Bradman 2nd inns -v- England at Melbourne Cricket Ground, 1932/33 191 England MC Cowdrey 1st inns -v- Australia at Melbourne Cricket Ground, 1954/55 193 West Indies GA Headley 1st inns -v- Australia at Exhibition Ground, Brisbane, 1930/31 194 West Indies RR Sarwan 2nd inns -v- South Africa at Queen's Park Oval, Port of Spain, 2004/05 198 Australia GN Yallop 1st inns -v- England at Sydney Cricket Ground, 1978/79 198 Australia KJ Hughes 1st inns -v- West Indies at Melbourne Cricket Ground, 1981/82 figures correct at 27-Nov-2009

The lowest all-out test innings to feature an individual double-century is also a fairly recent one. Virender Sehwag's 201* at Galle last summer was, notably, the only three-figure score of an otherwise low-scoring match, and certainly proved to be the difference between the two sides. Interestingly, this innings is the third-highest rated innings in test history according to the ICC rankings (the highest of Sehwag's three entries in the top ten). Opinions vary about the validity of the ICC rankings (it would help me make up my mind if they ever published how the blessed things are actually calculated), but one factor they seek to reward is runscoring that stands in contrast to a lower level of achievement by team-mates and opponents. This being the case, it is unsurprising to see Sehwag's sore thumb of an innings accorded very high value. All in all, there have been ten test innings in which a double-hundred is found amongst an all-out total of fewer than 400 runs.

Table 2: Lowest all-out test innings to feature an individual double-century

Total Team Centurion Match 329 India V Sehwag 1st inns -v- Sri Lanka at Galle International Stadium, 2008 344 England L Hutton 1st inns -v- West Indies at Kennington Oval, 1950 353 South Africa RG Pollock 1st inns -v- Australia at Newlands, Cape Town, 1966/67 371 Australia AR Morris 1st inns -v- England at Adelaide Oval, 1950/51 374 India AD Gaekwad 1st inns -v- Pakistan at Gandhi Stadium, Jalandhar, 1983/84 383 West Indies CL Walcott 1st inns -v- England at Kensington Oval, Bridgetown, 1953/54 386 New Zealand GM Turner 1st inns -v- West Indies at Sabina Park, Kingston, 1971/72 387 India DN Sardesai 1st inns -v- West Indies at Sabina Park, Kingston, 1970/71 390 West Indies BC Lara 1st inns -v- Sri Lanka at Sinhalese Sports Club Ground, Colombo, 2001/02 391 Australia ML Hayden 1st inns -v- India at MA Chidambaram Stadium, Chepauk, Chennai, 2000/01 figures correct at 27-Nov-2009

The answer to MiPiL's third question also features a game from the last twelve months. This time, our heroes are Jesse Ryder and Daniel Vettori. Between them, they scored 220 (79%) of the 279 runs New Zealand scraped together against India at Hamilton earlier this year. After their centuries, the next-highest score in the innings was just 18. In sixth place on the list, Allan Border and Greg Matthews had cause to be even more fed up with their colleagues: Border's 152* and Matthews's 115 amounted to over 80% of Australia's innings total, as they succumbed to an innings defeat in a match which is best remembered for Richard Hadlee's tour de force performance with the ball.

Table 3: Lowest all-out test innings to feature two individual centuries

Total Team Centurions Match 279 New Zealand JD Ryder; DL Vettori 1st inns -v- India at Seddon Park, Hamilton, 2008/09 284 Australia WM Lawry; IM Chappell 1st inns -v- West Indies at Brisbane Cricket Ground, Woolloongabba, Brisbane, 1968/69 313 England H Sutcliffe; GE Tyldesley 1st inns -v- South Africa at Old Wanderers, Johannesburg, 1927/28 328 Sri Lanka RP Arnold; RS Kaluwitharana 1st inns -v- Pakistan at Gaddafi Stadium, Lahore, 1998/99 329 West Indies RR Sarwan; S Chanderpaul 2nd inns -v- South Africa at Sahara Stadium, Kingsmead, Durban, 2003/04 333 Australia AR Border; GRJ Matthews 2nd inns -v- New Zealand at Brisbane Cricket Ground, Woolloongabba, Brisbane, 1985/86 335 Australia WM Woodfull; CG Macartney 1st inns -v- England at Old Trafford, Manchester, 1926 339 Australia GN Yallop; KJ Hughes 2nd inns -v- England at Brisbane Cricket Ground, Woolloongabba, Brisbane, 1978/79 344 England JH Hampshire; R Illingworth 1st inns -v- West Indies at Lord's Cricket Ground, St John's Wood, 1969 347 Australia GHS Trott; SE Gregory 2nd inns -v- England at Lord's Cricket Ground, St John's Wood, 1896 347 Sri Lanka RS Madugalle; A Ranatunga 1st inns -v- India at Sinhalese Sports Club Ground, Colombo, 1985 348 West Indies CH Gayle; RR Sarwan 2nd inns -v- South Africa at Centurion Park, 2003/04 349 Australia ML Hayden; AC Gilchrist 1st inns -v- India at Wankhede Stadium, Mumbai, 2000/01 350 Pakistan Hanif Mohammad; Saeed Ahmed 1st inns -v- India at Brabourne Stadium, Bombay, 1960/61 figures correct at 27-Nov-2009

In case MiPiL (or anyone else, for that matter) was interested in casting his net further than the test arena,
Tables 4–6, below, present analogous information to Tables 1–3 for all first-class cricket.

Table 4: Lowest all-out first-class innings to feature an individual century

Total Team Centurion Match 143 Gujranwala Rizwan Malik 1st inns -v- Bahawalpur at Bahawal Stadium, Bahawalpur, 14 Jan 2002 143 Nottinghamshire CEB Rice 1st inns -v- Hampshire at Dean Park, Bournemouth, 04 Jul 1981 144 Kent FE Woolley 2nd inns -v- Warwickshire at Cheriton Road Sports Ground, Folkestone, 24 Jun 1931 148 Parsees RP Meherhomji 2nd inns -v- Europeans at Gymkhana Ground, Bombay, 27 Aug 1907 153 Gloucestershire TW Graveney 1st inns -v- Essex at Gidea Park Sports Ground, Romford, 23 May 1956 156 Gloucestershire GM Emmett 1st inns -v- Oxford University at The University Parks, Oxford, 01 May 1948 157 Leicestershire S Jayasinghe 1st inns -v- Northamptonshire at County Ground, Northampton, 22 Aug 1964 157 Northamptonshire JE Timms 1st inns -v- Kent at Crabble Athletic Ground, Dover, 15 Aug 1934 158 Kent TG Evans 1st inns -v- Leicestershire at Grace Road, Leicester, 25 Aug 1951 159 New Zealand JR Reid 2nd inns -v- England at Lancaster Park, Christchurch, 15 Mar 1963 159 United South of England WG Grace 1st inns -v- United North of England Eleven at Argyle Street, Hull, 03 Aug 1876 159 Worcestershire TW Graveney 2nd inns -v- Leicestershire at Grace Road, Leicester, 01 Jun 1968 160 Nottinghamshire KP Pietersen 1st inns -v- Worcestershire at County Ground, New Road, Worcester, 29 Jun 2001 160 Wellington JR Reid 2nd inns -v- Auckland at Eden Park, Auckland, 01 Feb 1952 figures correct at 27-Nov-2009

Table 5: Lowest all-out first-class innings to feature an individual double-century

Total Team Centurion Match 282 Namibia G Snyman 2nd inns -v- Kenya at Sharjah Cricket Association Stadium, 29 Jan 2008 298 Gloucestershire TW Graveney 1st inns -v- Glamorgan at Rodney Parade, Newport, 08 Aug 1956 311 Glamorgan Javed Miandad 2nd inns -v- Essex at Castle Park Cricket Ground, Colchester, 29 Aug 1981 315 Victoria WH Ponsford 1st inns -v- South Australia at Adelaide Oval, 03 Dec 1926 321 Midlands DA Marillier 2nd inns -v- Manicaland at Kwekwe Sports Club, 12 Apr 2005 326 Sind Naoomal Jaoomal 1st inns -v- Nawanagar at Karachi Gymkhana Ground, 24 Dec 1938 328 Southern Punjab S Wazir Ali 1st inns -v- Bengal at Eden Gardens, Calcutta, 18 Feb 1939 329 India V Sehwag 1st inns -v- Sri Lanka at Galle International Stadium, 31 Jul 2008 329 Middlesex EH Hendren 1st inns -v- Northamptonshire at Lord's Cricket Ground, St John's Wood, 26 Aug 1931 331 Canterbury GT Dowling 1st inns -v- Wellington at Lancaster Park, Christchurch, 29 Dec 1962 332 Hampshire CG Greenidge 1st inns -v- Yorkshire at Headingley, Leeds, 30 Jul 1977 333 Northamptonshire L Livingston 1st inns -v- Nottinghamshire at Trent Bridge, Nottingham, 28 Aug 1954 337 Nottinghamshire CJ Poole 1st inns -v- Derbyshire at Rutland Recreation Ground, Ilkeston, 26 Jul 1952 338 Mysore V Subramanya 1st inns -v- Madras at MA Chidambaram Stadium, Chepauk, Madras, 21 Jan 1967 338 New South Wales SG Barnes 1st inns -v- Queensland at Brisbane Cricket Ground, Woolloongabba, Brisbane, 23 Nov 1945 figures correct at 27-Nov-2009

Table 6: Lowest all-out first-class innings to feature two individual centuries

Total Team Centurions Match 250 Otago BE Congdon; KO Campbell 1st inns -v- Central Districts at Carisbrook, Dunedin, 28 Dec 1972 252 Marylebone Cricket Club L Hutton; MC Cowdrey 1st inns -v- New South Wales at Sydney Cricket Ground, 12 Nov 1954 258 Hampshire CL Smith; KD James 1st inns -v- Derbyshire at Queen's Park, Chesterfield, 23 Jul 1991 268 Essex N Hussain; GA Gooch 1st inns -v- Hampshire at County Ground, Chelmsford, 16 Sep 1993 268 South Australia TC Plant; CJ Ferguson 2nd inns -v- New South Wales at Sydney Cricket Ground, 02 Dec 2004 269 Karachi Port Trust Ahmer Saeed; Saad Wasim 2nd inns -v- Pakistan Telecommunication Company Limited at Niaz Stadium, Hyderabad, 14 Feb 2005 271 Burgher Recreation Club DM Perumal; DN Pathirana 1st inns -v- Kurunegala Youth Cricket Club at Burgher Recreation Club Ground, Colombo, 31 Oct 2003 271 Lancashire W Place; BJ Howard 1st inns -v- Northamptonshire at Old Trafford, Manchester, 16 Jul 1947 272 Worcestershire NH Whiting; LF Outschoorn 1st inns -v- Oxford University at The University Parks, Oxford, 28 May 1952 275 Gentlemen of the South WL Murdoch; W Newham 1st inns -v- Players of the South at Lord's Cricket Ground, St John's Wood, 17 Sep 1894 279 New Zealand JD Ryder; DL Vettori 1st inns -v- India at Seddon Park, Hamilton, 18 Mar 2009 279 Warwickshire FC Gardner; AVG Wolton 1st inns -v- Sussex at Edgbaston, Birmingham, 02 May 1956 280 New South Wales HSB Love; HL Collins 2nd inns -v- Victoria at Melbourne Cricket Ground, 24 Dec 1921 figures correct at 27-Nov-2009

30 November 2009

Going downhill quickly

This post started off as quite a mundane analysis of workaday stats, but I think that analysis led to a reasonably interesting conclusion.

The catalyst was the recent match between India and Sri Lanka in Kanpur and, in particular, India's innings. They amassed 642, which proved quite enough to see Sri Lanka off by an innings and plenty; nevertheless, that impressive total was a bit of a comedown, given they had been 613/4 a dozen or so overs before they were bowled out. That's quite a collapse. A contributor to the Cricinfo text commentary summed it up rather neatly:

I have never seen such an unbalanced score card. When we look at the runs it is so lopsided on the the top that I feel my Cricinfo page will roll over by 180°.

I was party to some related discussions on both TMSB Exiles and Grockles. On the latter, Frome Exile came up with an interesting way of looking at the collapse: he worked out that there had only been one instance in test history of a larger absolute difference between the contributions of the first five partnerships and the last five. That was England's monstrous first innings of 849ao v. West Indies in Kingston, 1930, in which the fifth wicket fell at 720, meaning the first five wickets added 591 more than the last five (11 more than the corresponding discrepancy in India's Kanpur innings). In case anyone's interested, I've put a full list of test innings sorted in this way here.

A similar – though, I think, ever-so-slightly more informative – way of looking at the question is to concentrate on the relative difference between the amount of runs scored for the first five wickets and the amount scored for the second five – in other words, the proportion of the the final, all-out total that was contributed by the first five partnerships. The table below shows score at the fall of the fifth wicket, final total, and the relationship between the two for all all-out innings in test history (obviously, it doesn't make sense to ask the same question of innings that were declared or otherwise prematurely curtailed). The match at the top of the list is a famous, though statistically anomalous one, which only technically counts as an all-out innings.

The Sabina Park massacre aside, the most lopsided innings is one in which Australia's first 5 partnerships scored 61 times as many runs as the rest. In fact, the collapse was more dramatic than even that stat suggests, because the fifth-wicket partnership also realised no runs, so Australia – chasing 382 to win the match – fell from 305/3 to 310ao. The prime architect of Australia's demise was Sarfraz Nawaz, who took 7/1 in a spell of 33 balls, to finish with career-best figures of 9/86. Some sources refer to Sarfraz's feat as the first great spell of reverse-swing bowling in tests; others note that he took the new ball just before the rampage began, which would make such an interpretation unlikely. One way or another, it was a sensationally effective burst.

5thWkt Total (%) Team Inns Match 1. 97 97 100.00% India 2nd inns -v- West Indies at Sabina Park, Kingston, 1975/76 2. 305 310 98.39% Australia 2nd inns -v- Pakistan at Melbourne Cricket Ground, 1978/79 3. 261 266 98.12% New Zealand 1st inns -v- Pakistan at Basin Reserve, Wellington, 1964/65 4. 147 150 98.00% England 2nd inns -v- Australia at Melbourne Cricket Ground, 1990/91 5. 244 249 97.99% Australia 1st inns -v- England at Trent Bridge, Nottingham, 1953 6. 493 507 97.24% England 1st inns -v- Pakistan at National Stadium, Karachi, 1961/62 7. 127 131 96.95% New Zealand 2nd inns -v- Pakistan at Eden Park, Auckland, 2000/01 8. 221 228 96.93% England 2nd inns -v- Australia at Adelaide Oval, 1950/51 9. 204 211 96.68% India 2nd inns -v- England at Trent Bridge, Nottingham, 1996 10. 169 175 96.57% Sri Lanka 2nd inns -v- England at P Saravanamuttu Stadium, Colombo, 1981/82 11. 418 433 96.54% Australia 1st inns -v- England at Brisbane Cricket Ground, Woolloongabba, Brisbane, 1970/71 12. 554 576 96.18% West Indies 1st inns -v- India at Sabina Park, Kingston, 1952/53 13. 275 286 96.15% Pakistan 2nd inns -v- India at MA Chidambaram Stadium, Chepauk, Chennai, 1998/99 14. 323 336 96.13% West Indies 1st inns -v- England at Edgbaston, Birmingham, 2004 15. 213 222 95.95% Australia 1st inns -v- England at Edgbaston, Birmingham, 1968 16. 535 558 95.88% West Indies 1st inns -v- England at Trent Bridge, Nottingham, 1950 17. 507 529 95.84% England 1st inns -v- Australia at Melbourne Cricket Ground, 1974/75 18. 247 258 95.74% Australia 1st inns -v- England at Melbourne Cricket Ground, 1978/79 19. 134 140 95.71% South Africa 1st inns -v- England at Lord's Cricket Ground, St John's Wood, 1907 20. 488 510 95.69% Australia 1st inns -v- West Indies at Melbourne Cricket Ground, 1968/69 21. 350 366 95.63% India 1st inns -v- Australia at Melbourne Cricket Ground, 2003/04 22. 368 385 95.58% Sri Lanka 1st inns -v- India at P Saravanamuttu Stadium, Colombo, 1985 23. 85 89 95.51% West Indies 1st inns -v- England at Kennington Oval, 1957 24. 613 642 95.48% India 1st inns -v- Sri Lanka at Modi Stadium, Kanpur, 2009/10 25. 376 394 95.43% West Indies 1st inns -v- India at Kensington Oval, Bridgetown, 2001/02 26. 285 299 95.32% Pakistan 1st inns -v- Sri Lanka at Sinhalese Sports Club Ground, Colombo, 2009 27. 240 252 95.24% Pakistan 1st inns -v- South Africa at Newlands, Cape Town, 2002/03 28. 198 208 95.19% England 1st inns -v- South Africa at Trent Bridge, Nottingham, 1947 29. 270 284 95.07% England 1st inns -v- Australia at Melbourne Cricket Ground, 1920/21 30. 77 81 95.06% India 2nd inns -v- New Zealand at Basin Reserve, Wellington, 1975/76 ... ... 4909. 7 70 10.00% Australia 2nd inns -v- England at Old Trafford, Manchester, 1888 4910. 32 323 9.91% Australia 1st inns -v- England at Melbourne Cricket Ground, 1897/98 4911. 18 185 9.73% Zimbabwe 2nd inns -v- India at Queens Sports Club, Bulawayo, 2005/06 4912. 23 258 8.91% England 1st inns -v- West Indies at Queen's Park Oval, Port of Spain, 1934/35 4913. 14 169 8.28% Bangladesh 2nd inns -v- Zimbabwe at Harare Sports Club, 2003/04 4914. 15 212 7.08% Pakistan 2nd inns -v- Sri Lanka at Jinnah Stadium, Sialkot, 1995/96 4915. 6 98 6.12% India 1st inns -v- England at Kennington Oval, 1952 only all-out innings considered; figures correct at 27-Nov-2009; full list available here

India's Kanpur innings is 24th on the list, one of 30 test innings in which the last five wickets contributing less than five percent of the all-out total. At the other end of the table, there are seven instances of the first five partnerships providing 10% or less of the final score. That entry at the bottom isn't, as I immediately imagined, Trueman's debut, when India were famously reduced to 0/4; it's the fourth match of that series, in which they managed a whole 6 runs before losing their 4th wicket, but lost their 5th the next ball. On this occasion, it was Trueman's opening partner, Alec Bedser, who was the main destroyer; Norman Preston's Wisden write-up describes the carnage – and the subsequent revival led by Indian skipper Vijay Hazare – in detail.

Here's where the story begins to get a bit interesting. Having assembled all these stats, I casually had a glance at the typical relationship between these two variables (the amount of runs scored for the first five wickets, and the amount of runs scored in the remainder of the innings). The results were nothing like what I was expecting.

It turns out that score at the fall of the 5th wicket is a terrible predictor of the amount the last five wickets will contribute. I would have imagined that instances in which the first half of an innings was high-scoring would – noteworthy collapses aside – have been those in which the second half also went well for the batting team. Similarly, you'd guess that, if the first 5 fall over cheaply, the tail are unlikely to contribute much. It turns out that you can't make those sorts of assumption at all.

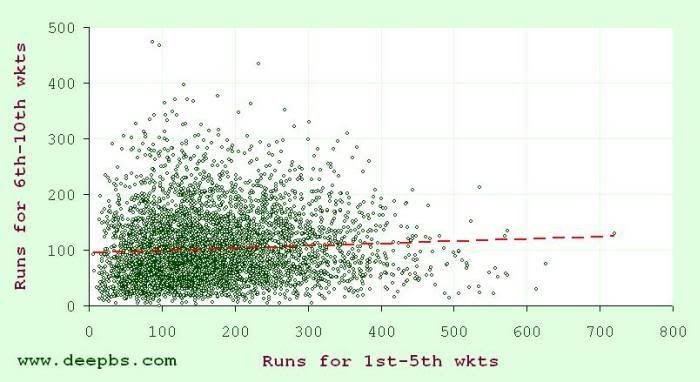
The graph below shows every all-out innings in test history, with runs for the first five wickets on the x-axis plotted against runs for the last 5 on the y. Before generating this plot, I expected to see a fairly noticeable positive correlation, with the datapoints lining up from the origin of the graph in a positive trend up and right. No such thing. It's all scatter and no plot, and r2 (which quantifies the strength of association between two variables – see this earlier post) is a dismal 0.0041.

Figure 1: All-out test innings – runs for the first five wickets and runs for the last five

FallOf5th

If you stick a linear regression line through the dataset (as I have, above), you get y = 95.5 + 0.0414x, which means that, at the fall of the fifth wicket, our best guess of what the all-out total will be is

runs scored so far + (0.0414 × runs scored so far) + 95.5

... but what this analysis shows very clearly is that you'd be an idiot to head off down the bookie's armed with that equation, because our best guess is dreadful. In fact, if it tells us anything, it suggests that dramatic collapses and dramatic tail-wagging are much more likely than you might imagine (maybe there's some value to be had there!) The lesson is clear: what happens in the first half of an innings tells us nothing about what we can expect in the second half. For example, on average throughout test history, whenever the fifth wicket has fallen at a score between 50 and 99, the remaining batsmen have added a further 95.7; whenever the first five partnerships have realised between 400 and 449, the last five wickets have typically amassed... 95.3.

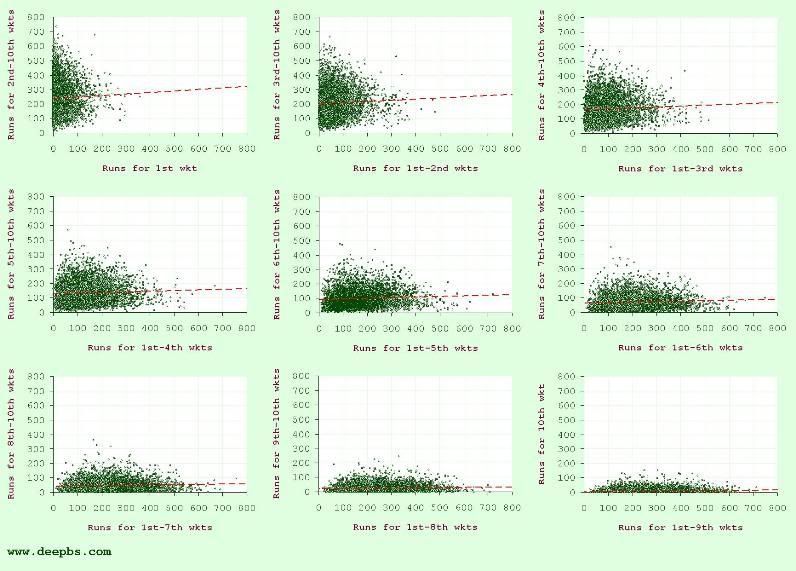
Further investigation shows that this finding is not confined to the fifth wicket. At any stage of a test innings, what has happened up until the fall of a given wicket is a useless predictor of what's going to happen afterwards. Figure 2 shows analogous graphs to that shown above for all other wickets. In every case, there's a whole lot of noise and no noticeable signal. The highest r2 for any of these analyses is that calculated for the ninth wicket – just 0.0053 (that is: only half a percent of the variance in the tenth-wicket partnership scores is explained by variability in totals at the fall of the ninth).

Figure 2: All-out test innings – correlations between scores before and after the loss of each wicket

FoW

I don't quite know what to make of these findings. At extreme ends of the spectrum, one can just about understand how two halves of an innings might compensate for each other. As Wickham observed on Grockles,

Part of the explanation may be that tail-enders are more likely to dig in if the top-order batsmen have scored relatively few runs and that this tendency helps to counteract the impact of wickets which are more difficult to bat on.

I am sure this is a useful observation. It seems to me that the reverse may be true, as well: if the top order have scored heavily, maybe the tail play with abandon in search of the quick runs that the match situation is likely to demand, and thereby score less heavily than they might have done. I don't know that these explanations help us with the majority of test innings, however. After all, most times, the tail are neither digging in for grim death nor swinging with carefree abandon.

The alternative explanation is that we massively overinterpret those factors we identify as significant in shaping an innings. We watch five batsmen fall quickly, and we conclude that the wicket is unreliable, or the bowlers irresistible; when the runs have come easily for the top order, we imagine that the conditions are favourable, or the attack toothless. But maybe we've got a bad appreciation of the random and – pace Louis MacNeice – cricket is crazier and more of it than we think. This is far from the first time that, having had a good dig into the evidence, I've reached the conclusion that the game is far more susceptible to dumb luck than we ever acknowledge.


Nervous noughties

Over on TMSB Exiles, groovyshortlegs noted

[Doug] Bollinger faces his first ball in ODIs, in his 5th match, and [he's] run out without facing another. He has one test, one innings 0*. 6 internationals, no runs, what's the longest streak I wonder?

Turns out the answer to groovy's question is Venkatesh Prasad. He had played in 12 internationals (all ODIs) before he registered his first international run. That run consisted of 2 ducks and 10 DNBs. Nathan Bracken played 11 ODIs before he even got a bat, but got off the mark at the first time of asking. Roger Harper played in 9 matches (3 ducks) before he scored his first run.

The players who actually got to the crease most times without scoring at the beginning of their careers were Brendon Bracewell (who started out with 5 0s - 4 in tests, 1 in an ODI) and Commandur Rangachari (who had 5 ducks before finally scoring in his fourth test).

At least Bollinger's matches have all come in 2009. Some players have taken up to a dozen years to get off the mark in international cricket. Top of the lot is Barbadian George Carew, who made his test debut for the West Indies v. England in Bridgetown on 8th January 1935. He was dismissed for nought in the first innings, and did not get the chance to bat in the second (due to what looks, from this distance, like a rather generous declaration). It was 1948 before he got another chance to break his duck, but it was an opportunity he seized, scoring 107 v. England in Trinidad. History has paid rather more attention to his opening partner, Andy Ganteaume (whose century remains the only one scored in a batsman's only test innings), but Carew set a record of his own by taking so long between his international bow and his first run.

Altogether, 65 players have seen at least a year go by between their international debut and the match in which they finally broke their duck:

Name InternationalDebut FirstRun Days 1. GM Carew 08/01/1935 11/02/1948 4,782 2. WH Copson 24/06/1939 16/08/1947 2,975 3. GP Swann 23/01/2000 01/10/2007 2,808 4. CM Bandara 27/05/1998 10/12/2005 2,754 5. TWJ Goddard 25/07/1930 24/07/1937 2,556 6. A Mishra 13/04/2003 06/11/2008 2,034 7. WCA Ganegama 08/04/2001 26/01/2006 1,754 8. Saiful Islam 31/12/1990 05/04/1995 1,556 9. G Duckworth 26/07/1924 11/08/1928 1,477 10. GRA de Silva 14/06/1975 09/06/1979 1,456 11. Sarfraz Nawaz 06/03/1969 29/12/1972 1,394 12. Shabbir Ahmed 19/09/1999 18/05/2003 1,337 13. RA Gaunt 24/01/1958 17/08/1961 1,301 14. GJ Hopkins 29/06/2004 20/12/2007 1,269 15. RJ Bright 30/03/1974 04/06/1977 1,162 16. PR Downton 23/12/1977 13/02/1981 1,148 17. MG Webb 05/03/1971 01/03/1974 1,092 18. DJG Sammy 08/07/2004 07/06/2007 1,064 19. AS Luseno 06/04/2003 01/03/2006 1,060 20. HT Davis 18/04/1994 14/02/1997 1,033 21. JP Yadav 06/11/2002 26/08/2005 1,024 22. NW Bracken 11/01/2001 26/10/2003 1,018 23. Munir Malik 04/12/1959 05/07/1962 944 24. TG Shaw 10/11/1991 08/04/1994 880 25. GB Troup 16/10/1976 16/02/1979 853 26. A Nehra 24/02/1999 07/06/2001 834 27. Arshad Khan 01/02/1993 11/04/1995 799 28. RD Jackman 13/07/1974 28/08/1976 777 29. HAPW Jayawardene 28/06/2000 21/07/2002 753 30. GB Legge 24/12/1927 10/01/1930 748 31. Tauseef Ahmed 27/02/1980 05/03/1982 737 32. BW Hilfenhaus 14/01/2007 16/01/2009 733 33. G Geary 26/07/1924 10/07/1926 714 34. ML Patel 14/09/2004 15/08/2006 700 35. PJ Ongondo 30/09/1999 18/08/2001 688 36. CPH Ramanayake 08/03/1986 02/01/1988 665 37. G Noblet 03/03/1950 22/12/1951 659 38. Shakeel Ahmed 01/05/1993 07/02/1995 647 39. PE McIntyre 26/01/1995 10/10/1996 623 =39. GN de Silva 30/04/1983 12/01/1985 623 41. JM Patel 26/02/1955 19/10/1956 601 42. W Mwayenga 24/11/2002 29/05/2004 552 =42. ML Nkala 27/09/1998 01/04/2000 552 44. Abdur Rauf 02/02/2008 04/07/2009 518 45. DB Close 23/07/1949 22/12/1950 517 46. H Verity 29/07/1931 02/12/1932 492 47. TB Mitchell 10/02/1933 08/06/1934 483 48. M Hayward 18/08/1998 09/12/1999 478 49. CL White 09/10/2005 14/01/2007 462 50. PK Lee 18/12/1931 23/02/1933 433 51. AL Logie 19/12/1981 23/02/1983 431 52. RS Ghai 05/12/1984 26/01/1986 417 53. PS Vaidya 22/02/1995 12/04/1996 415 54. KS More 05/12/1984 18/01/1986 409 55. Alamgir Kabir 21/07/2002 27/08/2003 402 56. GI Allott 13/01/1996 06/02/1997 390 57. Sarandeep Singh 25/11/2000 19/12/2001 389 58. SP Gupte 30/12/1951 21/01/1953 388 59. WB Phillips 22/10/1982 11/11/1983 385 60. E Otieno 18/10/2007 31/10/2008 379 61. MG Hughes 13/12/1985 26/12/1986 378 62. DI Joyce 13/06/2006 23/06/2007 375 63. VM Muddiah 12/12/1959 16/12/1960 370 64. GP Wickramasinghe 31/12/1990 02/01/1992 367 65. AP Grayson 10/10/2000 10/10/2001 365

By the way, the player who had most FC games under his belt without scoring had the misfortune never to record that elusive first run. John Howarth played 13 matches for Nottinghamshire in 1966 & 1967; in that time he registered 7 ducks (3 not-out) and 16 DNBs, but he never saw the scoreboard tick over next to his number. A similar fate was met by Somerset's Seymour Clark, who may have only played 5 FC games but, in that time, he managed 2 more innings than Howarth without ever scoring a run. It's probably not surprising that he got dropped after that.


UPDATE: Doug Bollinger finally got off the mark in the second innings of Australia's third test v. West Indies at Perth. That was his fourth visit to the crease in his tenth international game, meaning he's ended up in equal-third place with Roger Harper and RL Sanghvi.