10 June 2010

Achieving the right consistency (i) - additional tables

These additional tables accompany my post in Cricinfo's It Figures blog, Achieving the right consistency (i).

Table 1: Test batsmen sorted according to consistency (coefficient of variation) in score

Name M I R Ave RPI SD CoV ------------------------------------------------------------------------------ 1. MH Richardson 38 65 2,776 44.77 42.71 35.16 0.823 2. H Sutcliffe 54 84 4,555 60.73 54.23 45.24 0.834 3. TL Goddard 41 78 2,516 34.47 32.26 27.11 0.840 4. SM Katich 49 85 3,792 48.00 44.61 38.72 0.868 5. MS Dhoni 43 66 2,428 42.60 36.79 32.36 0.880 6. JB Hobbs 60 102 5,410 56.95 53.04 46.68 0.880 7. IR Redpath 66 120 4,737 43.46 39.48 34.89 0.884 8. JB Stollmeyer 32 56 2,159 42.33 38.55 34.20 0.887 9. PE Richardson 34 56 2,061 37.47 36.80 32.86 0.893 10. A Ranatunga 93 155 5,105 35.70 32.94 29.44 0.894 11. AW Nourse 45 83 2,234 29.79 26.92 24.13 0.896 12. DJ Bravo 34 63 2,009 32.40 31.89 28.65 0.898 13. CPS Chauhan 40 68 2,084 31.58 30.65 27.57 0.900 14. Rameez Raja 57 94 2,833 31.83 30.14 27.21 0.903 15. KF Barrington 82 131 6,806 58.67 51.95 47.36 0.911 16. AW Greig 58 93 3,599 40.44 38.70 35.55 0.919 17. FM Engineer 46 87 2,611 31.08 30.01 27.68 0.922 18. EJ Barlow 30 57 2,516 45.75 44.14 40.74 0.923 19. M Amarnath 69 113 4,378 42.50 38.74 35.85 0.925 20. AN Cook 56 101 4,197 44.18 41.55 38.56 0.928 21. RC Fredericks 59 109 4,334 42.49 39.76 37.02 0.931 22. JN Rhodes 52 80 2,532 35.66 31.65 29.63 0.936 23. CC McDonald 47 83 3,107 39.33 37.43 35.34 0.944 24. MEK Hussey 50 86 3,912 52.16 45.49 43.04 0.946 25. S Chanderpaul 123 210 8,669 48.70 41.28 39.17 0.949 26. BF Butcher 44 78 3,104 43.11 39.79 37.82 0.950 27. SM Pollock 108 156 3,781 32.32 24.24 23.12 0.954 28. CL Walcott 44 74 3,798 56.69 51.32 49.00 0.955 29. CH Lloyd 109 175 7,515 46.68 42.94 41.02 0.955 30. BL D'Oliveira 44 70 2,484 40.06 35.49 33.92 0.956 31. ME Waugh 128 209 8,029 41.82 38.42 36.73 0.956 32. JH Kallis 136 229 10,760 54.62 46.99 44.95 0.957 33. B Mitchell 42 80 3,471 48.89 43.39 41.54 0.958 34. Saeed Ahmed 41 78 2,991 40.42 38.35 36.80 0.960 35. AR Border 156 265 11,174 50.56 42.17 40.49 0.960 36. K Srikkanth 43 72 2,062 29.88 28.64 27.59 0.963 37. WJ Cronje 68 111 3,714 36.41 33.46 32.24 0.963 38. NCL O'Neill 41 69 2,779 45.56 40.28 38.89 0.966 39. ADR Campbell 60 109 2,858 27.22 26.22 25.32 0.966 40. Habibul Bashar 50 99 3,026 30.88 30.57 29.54 0.967 41. AL Logie 52 78 2,470 35.80 31.67 30.80 0.973 42. GR Marsh 50 93 2,854 33.19 30.69 29.93 0.975 43. MV Boucher 130 184 5,051 31.18 27.45 26.78 0.976 44. HW Taylor 42 76 2,936 40.78 38.63 37.75 0.977 45. WM Woodfull 35 54 2,300 46.00 42.59 41.63 0.977 46. DR Martyn 67 109 4,406 46.38 40.42 39.54 0.978 47. KP Pietersen 62 111 5,166 49.20 46.54 45.54 0.978 48. Majid Khan 63 106 3,931 38.92 37.08 36.33 0.980 49. C Washbrook 37 66 2,569 42.82 38.92 38.15 0.980 50. MJ Clarke 59 95 4,331 52.18 45.59 44.73 0.981 51. Wasim Raja 57 92 2,821 36.17 30.66 30.17 0.984 52. ED Weekes 48 81 4,455 58.62 55.00 54.21 0.986 53. GP Thorpe 100 179 6,744 44.66 37.68 37.22 0.988 54. JG Wright 82 148 5,334 37.83 36.04 35.61 0.988 55. G Boycott 108 193 8,114 47.73 42.04 41.57 0.989 56. DG Bradman 50 80 6,996 99.94 87.45 86.65 0.991 57. DI Gower 117 204 8,231 44.25 40.35 39.99 0.991 58. RB Kanhai 79 137 6,227 47.53 45.45 45.06 0.991 59. RA Smith 62 112 4,236 43.67 37.82 37.52 0.992 60. EH Hendren 51 83 3,525 47.64 42.47 42.14 0.992 61. AI Kallicharran 66 109 4,399 44.43 40.36 40.07 0.993 62. AP Gurusinha 41 70 2,452 38.92 35.03 35.01 0.999 63. AL Hassett 43 69 3,073 46.56 44.54 44.53 1.000 64. ER Dexter 62 102 4,502 47.89 44.14 44.17 1.001 65. AJ Stewart 133 235 8,463 39.55 36.01 36.04 1.001 66. AD Nourse 34 62 2,960 53.82 47.74 47.91 1.003 67. PJL Dujon 81 115 3,322 31.94 28.89 29.01 1.004 68. SC Ganguly 113 188 7,212 42.18 38.36 38.53 1.004 69. SMH Kirmani 88 124 2,759 27.05 22.25 22.38 1.006 70. Imran Khan 88 126 3,807 37.69 30.21 30.40 1.006 71. MC Cowdrey 114 188 7,624 44.07 40.55 40.89 1.008 72. MA Butcher 71 131 4,288 34.58 32.73 33.08 1.011 73. DL Haynes 116 202 7,487 42.30 37.06 37.49 1.011 74. G Gambhir 31 55 2,798 54.86 50.87 51.51 1.013 75. NS Sidhu 51 78 3,202 42.13 41.05 41.59 1.013 76. Saeed Anwar 55 91 4,052 45.53 44.53 45.15 1.014 77. AJ Strauss 73 133 5,622 43.92 42.27 42.92 1.015 78. APE Knott 95 149 4,389 32.75 29.46 29.99 1.018 79. WM Lawry 67 123 5,234 47.15 42.55 43.43 1.021 80. ML Jaisimha 39 71 2,056 30.69 28.96 29.57 1.021 81. CD McMillan 55 91 3,116 38.47 34.24 34.98 1.022 82. Sadiq Mohammad 41 74 2,579 35.82 34.85 35.61 1.022 83. CL Cairns 62 104 3,320 33.54 31.92 32.63 1.022 84. MG Burgess 50 92 2,684 31.21 29.17 29.82 1.022 85. RS Dravid 138 238 11,372 54.15 47.78 48.91 1.024 86. DC Boon 107 190 7,422 43.66 39.06 40.04 1.025 87. FE Woolley 64 98 3,283 36.08 33.50 34.35 1.025 88. WPUJC Vaas 110 162 3,089 24.32 19.07 19.59 1.028 89. M Leyland 41 65 2,764 46.07 42.52 43.73 1.028 90. WW Armstrong 50 84 2,863 38.69 34.08 35.12 1.030 91. HA Gomes 60 91 3,171 39.64 34.85 35.95 1.032 92. A Flower 63 112 4,794 51.55 42.80 44.22 1.033 93. PBH May 66 106 4,537 46.77 42.80 44.23 1.033 94. MJK Smith 50 78 2,278 31.64 29.21 30.23 1.035 95. MA Atherton 115 212 7,728 37.70 36.45 37.74 1.035 96. RB Richardson 86 146 5,949 44.40 40.75 42.22 1.036 97. RT Ponting 143 241 11,828 55.27 49.08 50.89 1.037 98. GR Viswanath 91 155 6,080 41.93 39.23 40.70 1.037 99. AC Parore 78 128 2,865 26.28 22.38 23.25 1.039 100. KD Walters 74 125 5,357 48.26 42.86 44.54 1.039 101. Saleem Malik 102 154 5,768 43.70 37.45 38.94 1.040 102. AL Wadekar 37 71 2,113 31.07 29.76 30.94 1.040 103. Yousuf Youhana 87 150 7,342 53.20 48.95 50.97 1.041 104. MR Ramprakash 52 92 2,350 27.33 25.54 26.63 1.043 105. TE Bailey 61 91 2,290 29.74 25.16 26.25 1.043 106. Mushtaq Mohammad 57 100 3,643 39.17 36.43 38.09 1.046 107. Inzamam-ul-Haq 119 198 8,829 50.16 44.59 46.63 1.046 108. SR Tendulkar 166 271 13,447 55.57 49.62 51.92 1.046 109. AH Jones 39 74 2,922 44.27 39.49 41.34 1.047 110. KJ Hughes 70 124 4,415 37.42 35.60 37.35 1.049 111. DB Vengsarkar 116 185 6,868 42.13 37.12 39.02 1.051 112. JV Coney 52 85 2,668 37.58 31.39 33.02 1.052 113. IVA Richards 121 182 8,540 50.24 46.92 49.43 1.053 114. PJP Burge 42 68 2,290 38.17 33.68 35.55 1.056 115. SM Gavaskar 124 214 10,122 51.12 47.30 49.96 1.056 116. SR Waugh 168 260 10,927 51.06 42.03 44.51 1.059 117. VS Hazare 30 52 2,192 47.65 42.15 44.80 1.063 118. M Azharuddin 99 147 6,215 45.04 42.28 44.94 1.063 119. Kapil Dev 131 184 5,248 31.05 28.52 30.36 1.065 120. TM Dilshan 60 95 3,691 43.42 38.85 41.39 1.065 121. AJ Lamb 79 139 4,656 36.09 33.50 35.69 1.065 122. RW Marsh 96 150 3,633 26.52 24.22 25.91 1.070 123. ME Trescothick 76 143 5,825 43.80 40.73 43.61 1.071 124. KR Miller 55 87 2,958 36.98 34.00 36.41 1.071 125. VVS Laxman 110 181 7,136 46.64 39.43 42.22 1.071 126. AC Gilchrist 95 135 5,475 47.61 40.56 43.45 1.071 127. JHB Waite 50 86 2,405 30.44 27.97 29.98 1.072 128. L Hutton 79 138 6,971 56.67 50.51 54.15 1.072 129. IM Chappell 75 136 5,345 42.42 39.30 42.20 1.074 130. DCS Compton 78 131 5,807 50.06 44.33 47.64 1.075 131. GS Sobers 93 160 8,032 57.78 50.20 54.02 1.076 132. KR Rutherford 55 99 2,465 27.09 24.90 26.80 1.076 133. GS Chappell 87 151 7,110 53.86 47.09 50.69 1.077 134. N Hussain 96 171 5,764 37.19 33.71 36.29 1.077 135. NJ Astle 81 137 4,702 37.02 34.32 37.02 1.079 136. PD Collingwood 59 103 4,057 43.62 39.39 42.54 1.080 137. MJ Slater 74 131 5,312 42.84 40.55 43.81 1.080 138. ND McKenzie 58 94 3,253 37.39 34.61 37.43 1.082 139. CG Borde 55 97 3,061 35.59 31.56 34.18 1.083 140. KC Wessels 40 71 2,788 41.00 39.27 42.55 1.084 141. CC Hunte 44 78 3,245 45.07 41.60 45.09 1.084 142. RN Harvey 79 137 6,149 48.42 44.88 48.64 1.084 143. A Flintoff 78 128 3,795 31.89 29.65 32.14 1.084 144. JR Reid 58 108 3,428 33.28 31.74 34.41 1.084 145. HP Tillakaratne 83 131 4,545 42.88 34.69 37.63 1.085 146. AB de Villiers 58 99 3,902 42.88 39.41 42.77 1.085 147. B Sutcliffe 42 76 2,727 40.10 35.88 38.95 1.085 148. VL Manjrekar 55 92 3,208 39.12 34.87 37.85 1.086 149. TW Graveney 79 123 4,882 44.38 39.69 43.11 1.086 150. RG Pollock 23 41 2,256 60.97 55.02 59.86 1.088 151. ML Hayden 102 182 8,437 50.22 46.36 50.43 1.088 152. Javed Miandad 124 189 8,832 52.57 46.73 50.89 1.089 153. IR Bell 57 100 3,863 42.92 38.63 42.14 1.091 154. Moin Khan 69 104 2,741 28.55 26.36 28.75 1.091 155. HM Amla 43 75 3,261 47.26 43.48 47.55 1.094 156. CG Macartney 35 55 2,131 41.78 38.75 42.39 1.094 157. TT Samaraweera 57 90 3,938 51.14 43.76 47.93 1.095 158. AR Morris 46 79 3,533 46.49 44.72 49.13 1.098 159. JL Langer 104 180 7,674 45.68 42.63 46.87 1.099 160. KC Sangakkara 88 147 7,549 55.10 51.35 56.65 1.103 161. GA Gooch 118 215 8,900 42.58 41.40 45.69 1.104 162. RA McLean 40 73 2,120 30.29 29.04 32.13 1.106 163. SV Manjrekar 37 61 2,043 37.15 33.49 37.11 1.108 164. GP Howarth 47 83 2,531 32.45 30.49 33.79 1.108 165. GC Smith 82 143 6,787 50.65 47.46 52.60 1.108 166. MP Vaughan 82 147 5,719 41.44 38.90 43.12 1.108 167. JH Edrich 76 127 5,138 43.54 40.46 44.99 1.112 168. SJ McCabe 39 62 2,748 48.21 44.32 49.33 1.113 169. PR Umrigar 59 94 3,631 42.22 38.63 43.02 1.114 170. Asif Iqbal 58 99 3,575 38.86 36.11 40.25 1.115 171. IA Healy 119 182 4,356 27.40 23.93 26.69 1.115 172. GM Wood 59 112 3,374 31.83 30.13 33.60 1.115 173. BB McCullum 51 86 2,773 34.23 32.24 35.98 1.116 174. MA Taylor 104 186 7,525 43.50 40.46 45.17 1.116 175. CL Hooper 102 173 5,762 36.47 33.31 37.21 1.117 176. CG Greenidge 108 185 7,558 44.72 40.85 45.70 1.119 177. KR Stackpole 43 80 2,807 37.43 35.09 39.27 1.119 178. WW Hinds 45 80 2,608 33.01 32.60 36.57 1.122 179. SP Fleming 111 189 7,172 40.07 37.95 42.61 1.123 180. RJ Hadlee 86 134 3,124 27.17 23.31 26.31 1.128 181. RR Sarwan 82 146 5,759 41.73 39.45 44.57 1.130 182. GA Hick 65 114 3,383 31.32 29.68 33.53 1.130 183. GM Turner 41 73 2,991 44.64 40.97 46.34 1.131 184. RB Simpson 62 111 4,869 46.82 43.86 49.70 1.133 185. SM Nurse 29 54 2,523 47.60 46.72 53.00 1.134 186. IT Botham 102 161 5,200 33.55 32.30 36.68 1.136 187. MJ Greatbatch 41 71 2,021 30.62 28.46 32.37 1.137 188. TG Evans 91 133 2,439 20.50 18.34 20.86 1.137 189. DL Vettori 98 149 3,820 30.08 25.64 29.17 1.138 190. W Bardsley 41 66 2,469 40.48 37.41 42.58 1.138 191. Kamran Akmal 47 80 2,472 32.96 30.90 35.25 1.141 192. DJ McGlew 34 64 2,440 42.07 38.13 43.52 1.141 193. WR Hammond 85 140 7,249 58.46 51.78 59.20 1.143 194. GS Blewett 46 79 2,552 34.03 32.30 36.98 1.145 195. DJ Cullinan 70 115 4,554 44.21 39.60 45.33 1.145 196. G Kirsten 101 176 7,289 45.27 41.41 47.43 1.145 197. C Hill 49 89 3,412 39.22 38.34 44.06 1.149 198. D Ganga 47 86 2,160 25.71 25.12 28.92 1.151 199. CH Gayle 85 150 5,848 40.61 38.99 44.91 1.152 200. LEG Ames 47 72 2,434 40.57 33.81 38.95 1.152 201. Aamer Sohail 47 83 2,823 35.29 34.01 39.25 1.154 202. AC Hudson 35 63 2,007 33.45 31.86 36.81 1.156 203. MD Crowe 77 131 5,444 45.37 41.56 48.03 1.156 204. AG Prince 54 87 3,195 42.60 36.72 42.48 1.157 205. Shoaib Mohammad 45 68 2,705 44.34 39.78 46.03 1.157 206. PA de Silva 93 159 6,361 42.98 40.01 46.34 1.158 207. R Benaud 63 97 2,201 24.46 22.69 26.33 1.160 208. DPMD Jayawardene 110 182 9,120 53.96 50.11 58.21 1.162 209. GA Headley 22 40 2,190 60.83 54.75 63.79 1.165 210. HH Gibbs 90 154 6,167 41.95 40.05 46.72 1.167 211. DM Jones 52 89 3,631 46.55 40.80 47.62 1.167 212. Mohsin Khan 48 79 2,709 37.11 34.29 40.07 1.169 213. A Kumble 132 173 2,506 17.77 14.49 16.98 1.172 214. P Roy 43 79 2,442 32.56 30.91 36.37 1.177 215. SL Campbell 52 93 2,882 32.38 30.99 36.57 1.180 216. Nawab of Pataudi 46 83 2,793 34.91 33.65 39.82 1.183 217. Mudassar Nazar 76 116 4,114 38.09 35.47 42.00 1.184 218. FMM Worrell 51 87 3,860 49.49 44.37 52.74 1.189 219. Younis Khan 63 112 5,260 50.10 46.96 55.92 1.191 220. RD Jacobs 65 112 2,577 28.32 23.01 27.40 1.191 221. SK Warne 144 197 3,142 17.46 15.95 19.06 1.195 222. MW Gatting 79 138 4,409 35.56 31.95 38.24 1.197 223. KWR Fletcher 59 96 3,272 39.90 34.08 40.82 1.198 224. BE Congdon 61 114 3,448 32.22 30.25 36.34 1.202 225. WJ Edrich 39 63 2,440 40.00 38.73 46.67 1.205 226. BC Lara 130 230 11,912 53.18 51.79 62.43 1.205 227. JC Adams 54 90 3,012 41.26 33.47 40.42 1.208 228. VT Trumper 48 89 3,163 39.05 35.54 43.37 1.220 229. RM Cowper 27 46 2,061 46.84 44.80 54.88 1.225 230. GT Dowling 39 77 2,306 31.16 29.95 36.93 1.233 231. W Rhodes 58 98 2,325 30.19 23.72 29.28 1.234 232. GN Yallop 39 70 2,756 41.13 39.37 48.86 1.241 233. GW Flower 67 123 3,457 29.55 28.11 34.96 1.244 234. Ijaz Ahmed 60 92 3,315 37.67 36.03 45.08 1.251 235. Imtiaz Ahmed 41 72 2,079 29.28 28.88 36.14 1.252 236. RS Mahanama 51 89 2,576 29.27 28.94 36.25 1.252 237. RJ Shastri 80 121 3,830 35.79 31.65 39.65 1.253 238. V Sehwag 75 128 6,608 53.72 51.63 64.71 1.254 239. WH Ponsford 29 48 2,122 48.23 44.21 55.55 1.257 240. DN Sardesai 30 55 2,001 39.24 36.38 46.00 1.264 241. JA Rudolph 35 63 2,028 36.21 32.19 41.00 1.274 242. Hanif Mohammad 55 97 3,915 43.99 40.36 51.40 1.274 243. ST Jayasuriya 110 188 6,973 40.07 37.09 47.57 1.283 244. BA Young 35 68 2,034 31.78 29.91 38.98 1.303 245. DW Randall 47 79 2,470 33.38 31.27 40.90 1.308 246. Zaheer Abbas 78 124 5,062 44.80 40.82 54.00 1.323 247. SE Gregory 58 100 2,282 24.54 22.82 30.33 1.329 248. LG Rowe 29 49 2,047 43.55 41.78 55.98 1.340 249. GJ Whittall 46 82 2,207 29.43 26.91 36.45 1.354 250. DL Amiss 50 88 3,612 46.31 41.05 55.74 1.358 251. MS Atapattu 90 156 5,502 39.02 35.27 49.93 1.416 252. Mohammad Ashraful 55 107 2,306 22.39 21.55 30.70 1.425 253. Wasim Akram 104 147 2,898 22.64 19.71 28.15 1.428 254. MH Mankad 44 72 2,109 31.48 29.29 46.06 1.572 qual. = 2,000 runs; figures correct at 10-Jun-2010


Table 2: ODI batsmen sorted according to consistency (coefficient of variation) in score

Name M I R Ave RPI SD CoV ------------------------------------------------------------------------------ 1. MG Bevan 232 196 6,912 53.58 35.27 25.60 0.726 2. MEK Hussey 137 113 4,029 53.01 35.65 26.04 0.730 3. RR Sarwan 156 146 5,098 43.95 34.92 27.98 0.801 4. AH Jones 87 87 2,784 35.69 32.00 25.72 0.804 5. NH Fairbrother 75 71 2,092 39.47 29.46 23.81 0.808 6. IR Bell 78 76 2,483 35.47 32.67 26.45 0.810 7. GP Thorpe 82 77 2,380 37.19 30.91 25.04 0.810 8. CG Greenidge 128 127 5,134 45.04 40.43 33.01 0.817 9. AJ Lamb 122 118 4,010 39.31 33.98 27.87 0.820 10. RG Twose 87 81 2,717 38.81 33.54 27.54 0.821 11. Javed Miandad 233 218 7,381 41.70 33.86 27.81 0.821 12. DM Jones 164 161 6,068 44.62 37.69 31.03 0.823 13. DC Boon 181 177 5,964 37.04 33.69 27.87 0.827 14. DB Vengsarkar 129 120 3,508 34.73 29.23 24.21 0.828 15. WJ Cronje 188 175 5,565 38.65 31.80 26.36 0.829 16. Yasir Hameed 56 56 2,028 36.87 36.21 30.05 0.830 17. Zaheer Abbas 62 60 2,572 47.63 42.87 35.58 0.830 18. KC Wessels 109 105 3,367 34.36 32.07 26.69 0.832 19. HH Dippenaar 101 89 3,300 44.00 37.08 31.05 0.837 20. ML Hayden 160 154 6,131 44.11 39.81 33.38 0.838 21. GC Smith 153 151 5,732 40.37 37.96 31.86 0.839 22. MJ Clarke 170 154 5,263 42.79 34.18 28.76 0.842 23. Imran Khan 175 151 3,709 33.41 24.56 20.70 0.843 24. S Chanderpaul 261 245 8,648 41.78 35.30 29.96 0.849 25. MA Taylor 113 110 3,514 32.24 31.95 27.12 0.849 26. Inzamam-ul-Haq 374 348 11,701 39.53 33.62 28.58 0.850 27. JN Rhodes 245 220 5,935 35.12 26.98 22.93 0.850 28. MS Dhoni 159 141 5,246 50.44 37.21 31.79 0.855 29. JH Kallis 298 284 10,809 46.59 38.06 32.68 0.859 30. RP Arnold 180 155 3,950 35.27 25.48 21.93 0.861 31. Yousuf Youhana 275 261 9,458 42.80 36.24 31.25 0.862 32. RS Dravid 335 309 10,644 39.42 34.45 29.71 0.863 33. KR Rutherford 121 115 3,143 29.65 27.33 23.60 0.864 34. JG Wright 149 148 3,891 26.47 26.29 22.87 0.870 35. GR Marsh 117 115 4,357 39.97 37.89 33.02 0.871 36. DJ Cullinan 138 133 3,860 32.71 29.02 25.42 0.876 37. MD Crowe 143 140 4,704 38.56 33.60 29.44 0.876 38. DS Lehmann 117 101 3,078 38.96 30.48 26.77 0.879 39. A Ranatunga 269 255 7,456 35.85 29.24 25.70 0.879 40. KP Pietersen 96 86 3,202 45.10 37.23 32.83 0.882 41. AB de Villiers 96 92 3,466 44.44 37.67 33.43 0.887 42. CZ Harris 250 213 4,379 29.00 20.56 18.28 0.889 43. NV Knight 100 100 3,637 40.41 36.37 32.37 0.890 44. KC Sangakkara 260 243 7,893 36.37 32.48 28.92 0.890 45. IT Botham 116 106 2,113 23.22 19.93 17.76 0.891 46. SR Waugh 325 288 7,569 32.91 26.28 23.43 0.891 47. M Azharuddin 334 308 9,378 36.92 30.45 27.15 0.892 48. L Klusener 171 137 3,576 41.10 26.10 23.37 0.895 49. RT Ponting 341 332 12,623 42.79 38.02 34.11 0.897 50. AJ Stewart 170 162 4,677 31.60 28.87 25.95 0.899 51. HP Tillakaratne 200 168 3,789 29.60 22.55 20.30 0.900 52. NS Sidhu 136 127 4,413 37.08 34.75 31.30 0.901 53. MS Atapattu 268 259 8,529 37.57 32.93 29.69 0.902 54. A Flower 213 208 6,786 35.34 32.63 29.43 0.902 55. IVA Richards 187 167 6,721 47.00 40.25 36.45 0.906 56. CL Cairns 214 192 4,881 29.23 25.42 23.10 0.908 57. AD Jadeja 196 179 5,359 37.48 29.94 27.32 0.912 58. Saleem Malik 283 256 7,170 32.89 28.01 25.59 0.914 59. SK Raina 93 77 2,297 37.66 29.83 27.28 0.914 60. CL Hooper 227 206 5,761 35.34 27.97 25.69 0.919 61. Saeed Anwar 247 244 8,824 39.22 36.16 33.34 0.922 62. GA Gooch 125 122 4,290 36.98 35.16 32.48 0.924 63. SM Gavaskar 108 102 3,092 35.14 30.31 28.06 0.926 64. AP Gurusinha 146 143 3,902 28.28 27.29 25.32 0.928 65. TM Odoyo 114 101 2,113 24.01 20.92 19.42 0.928 66. DR Martyn 205 179 5,259 41.09 29.38 27.40 0.932 67. ME Waugh 243 236 8,500 39.35 36.02 33.62 0.934 68. Moin Khan 219 183 3,266 23.00 17.85 16.66 0.934 69. SP Fleming 279 268 8,007 32.42 29.88 27.94 0.935 70. HH Streak 187 157 2,901 28.44 18.48 17.29 0.936 71. GJ Whittall 147 142 2,705 22.54 19.05 17.85 0.937 72. MJ Greatbatch 84 83 2,206 28.28 26.58 24.96 0.939 73. Mudassar Nazar 122 115 2,653 25.27 23.07 21.74 0.942 74. BC Lara 295 285 10,348 40.90 36.31 34.28 0.944 75. A Flintoff 138 119 3,293 31.97 27.67 26.14 0.945 76. Aamer Sohail 155 155 4,780 31.87 30.84 29.23 0.948 77. WPUJC Vaas 321 219 2,018 13.73 9.21 8.73 0.948 78. E Chigumbura 110 102 2,241 24.63 21.97 20.85 0.949 79. AC Gilchrist 283 275 9,415 35.66 34.24 32.50 0.949 80. DL Haynes 238 237 8,648 41.38 36.49 34.67 0.950 81. VG Kambli 104 97 2,477 32.59 25.54 24.28 0.951 82. GM Wood 83 77 2,219 33.62 28.82 27.42 0.951 83. JC Adams 126 105 2,204 28.62 20.99 20.00 0.953 84. GA Hick 120 118 3,846 37.34 32.59 31.12 0.955 85. RR Singh 136 113 2,336 25.96 20.67 19.75 0.955 86. GS Chappell 74 72 2,331 40.19 32.38 30.93 0.955 87. SC Ganguly 308 297 11,221 40.95 37.78 36.11 0.956 88. G Kirsten 185 185 6,798 40.95 36.75 35.13 0.956 89. PD Collingwood 176 160 4,596 36.48 28.73 27.57 0.960 90. CD McMillan 197 183 4,707 28.19 25.72 24.77 0.963 91. BRM Taylor 102 101 2,889 31.75 28.60 27.57 0.964 92. SV Carlisle 111 107 2,740 27.68 25.61 24.71 0.965 93. Rameez Raja 198 197 5,841 32.09 29.65 28.64 0.966 94. RB Richardson 224 217 6,248 33.41 28.79 27.83 0.967 95. AR Border 273 252 6,524 30.63 25.89 25.04 0.967 96. V Sehwag 211 205 6,813 34.58 33.23 32.17 0.968 97. GW Flower 219 212 6,536 33.69 30.83 29.87 0.969 98. RS Mahanama 213 198 5,162 29.50 26.07 25.26 0.969 99. SL Campbell 90 87 2,283 26.24 26.24 25.51 0.972 100. AJ Strauss 99 98 2,886 32.07 29.45 28.65 0.973 101. Younis Khan 202 196 5,765 32.57 29.41 28.69 0.976 102. Abdur Razzaq 232 201 4,541 29.88 22.59 22.06 0.976 103. SR Watson 105 88 2,690 40.15 30.57 29.88 0.978 104. PA de Silva 308 296 9,284 34.90 31.36 30.79 0.982 105. SR Tendulkar 442 431 17,598 45.12 40.83 40.14 0.983 106. K Srikkanth 146 145 4,091 29.01 28.21 27.80 0.985 107. A Symonds 195 158 5,020 39.84 31.77 31.36 0.987 108. MV Boucher 287 213 4,501 28.67 21.13 20.89 0.989 109. RJ Shastri 150 128 3,108 29.05 24.28 24.03 0.990 110. Yuvraj Singh 247 227 7,253 37.01 31.95 31.70 0.992 111. LRPL Taylor 80 74 2,257 35.83 30.50 30.26 0.992 112. DPMD Jayawardene 312 293 8,433 31.94 28.78 28.59 0.993 113. MW Gatting 92 88 2,095 29.51 23.81 23.72 0.996 114. WU Tharanga 96 92 3,017 33.52 32.79 32.71 0.997 115. TM Dilshan 179 156 4,508 35.50 28.90 28.85 0.998 116. CH Gayle 217 212 7,830 39.75 36.93 37.08 1.004 117. G Gambhir 96 92 3,148 37.48 34.22 34.37 1.004 118. N Hussain 88 87 2,332 30.29 26.80 26.97 1.006 119. RL Powell 109 100 2,085 24.82 20.85 20.98 1.006 120. SB Styris 165 143 3,942 32.58 27.57 27.81 1.009 121. Shoaib Malik 190 170 5,141 34.50 30.24 30.56 1.011 122. Shakib Al Hasan 85 81 2,288 34.15 28.25 28.74 1.017 123. AL Logie 158 133 2,809 28.96 21.12 21.54 1.020 124. ME Trescothick 123 122 4,335 37.37 35.53 36.30 1.021 125. Habibul Bashar 111 105 2,168 21.68 20.65 21.11 1.022 126. AC Parore 179 161 3,314 25.69 20.58 21.22 1.031 127. Shahid Afridi 288 270 5,920 23.49 21.93 22.60 1.031 128. SM Pollock 294 196 3,193 25.34 16.29 16.83 1.033 129. AC Hudson 89 88 2,559 29.41 29.08 30.10 1.035 130. RA Smith 71 70 2,419 39.02 34.56 35.94 1.040 131. Salman Butt 76 76 2,651 36.82 34.88 36.39 1.043 132. MN Samuels 107 99 2,513 30.28 25.38 26.50 1.044 133. SO Tikolo 121 117 3,245 30.33 27.74 28.97 1.044 134. JDP Oram 138 101 2,189 24.88 21.67 22.66 1.045 135. S Matsikenyeri 109 106 2,196 22.64 20.72 21.71 1.048 136. Tamim Iqbal 76 76 2,228 29.32 29.32 30.75 1.049 137. T Taibu 119 106 2,456 28.56 23.17 24.30 1.049 138. HH Gibbs 248 240 8,094 36.13 33.73 35.67 1.058 139. PV Simmons 143 138 3,675 28.94 26.63 28.20 1.059 140. M Kaif 125 110 2,753 32.01 25.03 26.53 1.060 141. ADR Campbell 187 184 5,185 30.50 28.18 29.89 1.061 142. Ijaz Ahmed 250 232 6,564 32.33 28.29 30.05 1.062 143. Wasim Akram 356 280 3,717 16.52 13.28 14.11 1.063 144. NJ Astle 223 217 7,090 34.93 32.67 35.07 1.073 145. ST Jayasuriya 440 428 13,362 32.59 31.22 33.78 1.082 146. Kamran Akmal 115 100 2,288 26.30 22.88 24.80 1.084 147. BB McCullum 171 145 3,569 29.02 24.61 26.77 1.088 148. DI Gower 114 111 3,170 30.78 28.56 31.17 1.091 149. Mohammad Ashraful 157 151 3,298 23.90 21.84 24.09 1.103 150. Kapil Dev 225 198 3,783 23.79 19.11 21.10 1.105 151. WW Hinds 119 111 2,880 28.51 25.95 28.83 1.111 152. RS Kaluwitharana 189 181 3,711 22.22 20.50 22.79 1.112 153. VVS Laxman 86 83 2,338 30.76 28.17 31.66 1.124 154. L Vincent 102 99 2,413 27.11 24.37 28.05 1.151 155. H Masakadza 95 95 2,601 28.58 27.38 32.86 1.200 156. KO Otieno 89 87 2,016 23.44 23.17 28.16 1.215 qual. = 2,000 runs; figures correct at 10-Jun-2010
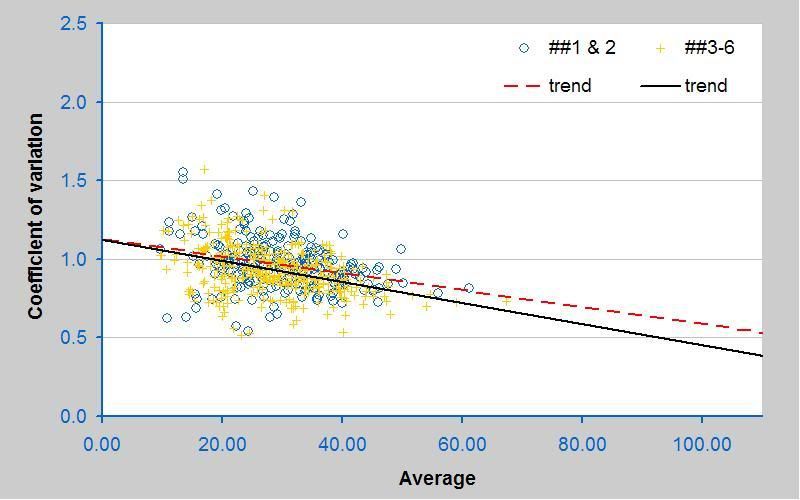


Figure 3a: Association between consistency (coefficient of variation) and success (average) for ODI batsmen stratified according to batting position
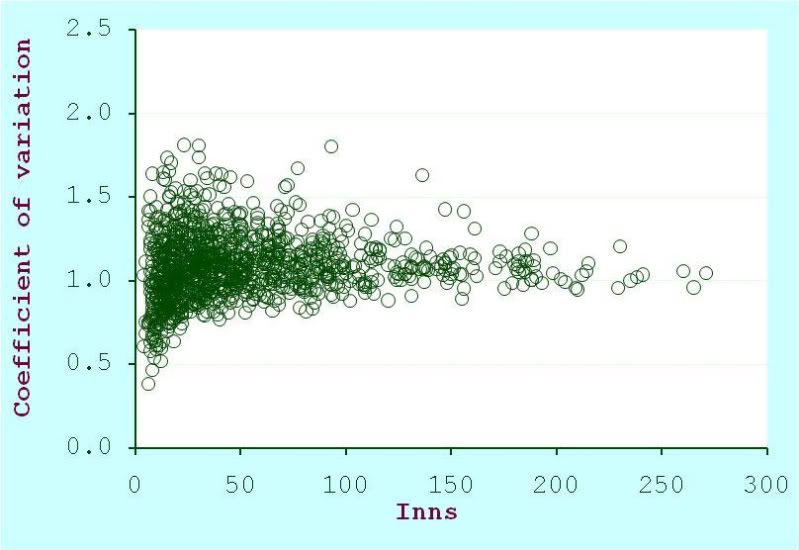


New Figure: Association between consistency (coefficient of variation) and number of innings in test cricket

31 January 2010

A decade of two divisions

We've just passed one important little milestone that (as far as I saw) went with little recognition: English county cricket now has ten years' experience of a two-divisional structure. Having realised this, my response, characteristically enough, was to crunch a few numbers from the period.

To start with, I looked at how each county has performed throughout the decade. Table 1 collects each season's final standings into a single meta-championship, ordered according to points attained across both divisions. Data are separated according to division, with first division figures presented first and, where applicable, an overall total for both divisions given at the end.

Table 1: County championship, 2000–2009

(Div1+Div2) Bonus Points ---------------------------- Seasons P W Batting Bowling Points* Titles ---------------------------------------------------------------------------------------------------------- 1. Surrey 8+2 128+32 (42+11) 53 (408+116) 524 (338+80) 418 (1522.25+410) 1932.25 2+1 2. Sussex 8+2 128+32 (44+12) 56 (384+73) 457 (348+81) 429 (1553+342) 1895.00 3+1 3. Lancashire 9+1 144+16 (45+7) 52 (371+43) 414 (385+47) 432 (1654+212) 1866.00 0+1 4. Nottinghamshire 5+5 80+80 (24+28) 52 (219+258) 477 (210+212) 422 (896+957) 1853.00 1+1 5. Warwickshire 7+3 112+48 (35+12) 47 (335+146) 481 (284+121) 405 (1303+548.75) 1851.75 1+1 6. Kent 9+1 144+16 (45+8) 53 (376+43) 419 (385+44) 429 (1599+219) 1818.00 0+1 7. Essex 2+8 32+128 (5+47) 52 (62+349) 411 (81+332) 413 (272+1498) 1770.00 0+1 8. Hampshire 7+3 112+48 (33+18) 51 (264+112) 376 (316+128) 444 (1207.5+560) 1767.50 0+0 9. Northamptonshire 2+8 32+128 (3+44) 47 (87+363) 450 (77+331) 408 (282+1481.5) 1763.50 0+1 10. Yorkshire 7+3 112+48 (29+12) 41 (309+147) 456 (306+129) 435 (1185.75+546) 1731.75 1+0 11. Somerset 5+5 80+80 (15+25) 40 (229+238) 467 (215+206) 421 (830.75+893) 1723.75 0+1 12. Worcestershire 3+7 48+112 (4+45) 49 (99+306) 405 (115+304) 419 (350+1353) 1703.00 0+1 13. Middlesex 4+6 64+96 (12+25) 37 (197+267) 464 (168+260) 428 (663+1029.25) 1692.25 0+0 14. Durham 5+5 80+80 (27+17) 44 (190+157) 347 (220+214) 434 (893+713.5) 1606.50 2+0 15. Leicestershire 4+6 64+96 (15+19) 34 (158+223) 381 (172+241) 413 (626.5+911.5) 1538.00 0+0 16. Gloucestershire 2+8 32+128 (4+30) 34 (75+310) 385 (87+332) 419 (276+1259.5) 1535.50 0+0 17. Glamorgan 2+8 32+128 (3+28) 31 (69+320) 389 (75+331) 406 (221.5+1258.5) 1480.00 0+0 18. Derbyshire 1+9 16+144 (2+25) 27 (19+323) 342 (44+388) 432 (111+1280.5) 1391.50 0+0 * sum of points as awarded according to rules pertaining in each season, including deductions for slow over rates and substandard pitches

So, the team who have won most points overall is Surrey, though they are only fourth on the list of division one points-scorers. Mind you, the two sides who have played most seasons, won most games, and collected most points in division one cricket – Lancashire and Kent – have yet to raise the pennant in the two-division era. Surrey have also amassed most batting bonus points (both overall and in division one). Hampshire have most bowling bonus points across both divisions; Lancashire and Kent tie (again) for most first division bowling points. On the whole, there's much less variability in bowling bonus points: the lowest-scoring team – Warwickshire – are only 40 points behind the leaders, whereas Derbyshire's haul of batting points is very nearly 200 points behind Surrey's.

Because rules have changed, over the decade, some teams may benefit from having been at their strongest when points were most easily available. To get around this problem, I worked out how many points each team would have accumulated according to a uniform points system (and, because I'm interested to see if it will have much impact, I've used the schema that will be in place in 2010, with 16 points for a win and 3 for a draw). One would need more detailed information on the course of each match than I have available to me to standardise the number of first-innings overs in which bonus points can be scored (the threshold for which has also changed over the years), so I simply ignored the over-limit, and awarded bonus points for all first innings at their completion. I did reapply the deductions, though. After all that, it turns out that it makes next-to-no difference, anyway. When ranked according to all points won (as above), Hampshire and Northamptonshire swap places, as do Somerset and Worcestershire. By and large, though, it's as you were.

While I was fiddling about with recalculating points tables, I had a quick look to see if the 2010 rules would have made any difference to the final standings in any year. There are three instances in which they would have: Gloucestershire, not Glamorgan, would have been promoted in 2000; Yorkshire, not Nottinghamshire, would have been relegated in 2006; and Yorkshire, not Kent, would have been relegated in 2008. Perhaps the most interesting of these is the last. If Kent had stayed up for 2009, they would have been the only team to make it through the whole decade without once slipping from the top flight.

An unanswered question is how much real difference there is between the divisions. Because cricket is a zero-sum game, it is not possible to draw inferences from overall figures (a higher standard of cricket cannot, logically, be reflected in a higher overall batting average and a lower overall bowling average; if one goes up, so does the other). One way to get a handle on the matter is to look at how individual players have performed in each environment; one would expect both batsmen and bowlers who have played in both divisions to have inferior records in the top flight if the quality of cricket really is higher there.

And, by and large, that is what the figures show. Over the decade, individual batsmen averaged a median of 1.7 runs fewer in division one than they did in division two. A similar trend is seen on a season-by-season level: batsmen stepping up from division two to division one averaged a median of 2.3 runs fewer in the season following promotion than they had the year before.

Table 2 shows the batsmen with the greatest differences – both positive and negative – between their records in the two divisions. The top of the table lists those whose second division figures far exceed their performance in the top flight; at the bottom, we find batsmen for whom the challenge of first division cricket seems to have been a stimulus to higher levels of achievement.

Table 2: Difference between first and second division batting average, 2000–2009

Division One Division Two ------------------------ ------------------------ Name I NO R Ave I NO R Ave diff ----------------------------------------------------------------------------------- RC Irani 46 2 1,211 27.52 110 23 5,462 62.78 -35.26 M van Jaarsveld 118 7 5,060 45.59 24 3 1,475 70.24 -24.65 IR Bell 124 11 4,810 42.57 21 3 1,142 63.44 -20.88 PD Collingwood 33 1 792 24.75 73 7 2,943 44.59 -19.84 JL Langer 47 3 1,914 43.50 53 4 3,093 63.12 -19.62 IJL Trott 139 13 5,351 42.47 25 5 1,240 62.00 -19.53 SM Katich 43 4 1,723 44.18 50 9 2,610 63.66 -19.48 MR Ramprakash 159 22 9,368 68.38 61 8 4,649 87.72 -19.34 GO Jones 94 14 2,644 33.05 25 0 1,291 51.64 -18.59 WI Jefferson 52 4 1,117 23.27 88 7 3,362 41.51 -18.24 JS Foster 44 0 1,036 23.55 145 20 5,177 41.42 -17.87 MA Wagh 147 11 5,048 37.12 62 7 3,015 54.82 -17.70 MP Maynard 22 0 641 29.14 93 5 3,906 44.39 -15.25 DJ Hussey 51 6 2,741 60.91 37 5 2,427 75.84 -14.93 MEK Hussey 43 5 2,497 65.71 60 8 4,150 79.81 -14.10 IJ Sutcliffe 156 10 4,764 32.63 24 2 1,016 46.18 -13.55 CR Taylor 21 1 333 16.65 37 1 1,062 29.50 -12.85 AD Brown 184 22 6,687 41.28 26 4 1,177 53.50 -12.22 SJ Walters 20 1 355 18.68 24 0 739 30.79 -12.11 A McGrath 148 10 5,372 38.93 62 7 2,802 50.95 -12.02 ... TJ Murtagh 42 18 774 32.25 62 12 925 18.50 13.75 MP Dowman 26 3 699 30.39 35 0 580 16.57 13.82 SG Law 157 18 8,298 59.70 54 4 2,249 44.98 14.72 AV Suppiah 31 1 1,328 44.27 34 0 998 29.35 14.91 TT Bresnan 68 14 1,680 31.11 38 6 511 15.97 15.14 NRD Compton 34 3 1,289 41.58 50 2 1,264 26.33 15.25 DJG Sales 25 5 1,230 61.50 171 12 7,034 44.24 17.26 A Dale 23 3 1,026 51.30 89 8 2,562 31.63 19.67 MJ Prior 152 10 5,624 39.61 24 2 433 19.68 19.92 JP Maher 53 4 2,111 43.08 35 0 761 21.74 21.34 qual. = 20 inns in each division; full list available here

It is interesting to see three of England's current top 6 in the upper reaches of this table, with first division averages some twenty runs lower than their second division figures. They may be slightly balanced by Matt Prior, who is second only to Jimmy Maher amongst those who have done better in the first division. Among other notable names in the table, it is unlikely that Mark Ramprakash or the Hussey brothers will face too much criticism for the discrepancy between their first and second division averages, given that they each managed 60+ in the top flight. The most consistent of the lot is Brad Hodge, who has 2,063 runs at 50.32 in division one, and 2,163 at 50.30 in division two.

A similar picture is seen with bowlers. Over the decade, individual bowlers averaged a median of 1.8 runs fewer in division 2 than they did in division 1. However, bowlers stepping up from division 2 to division 1 appear to have found the transition particularly challenging, averaging a median of 5.4 runs more in the season following promotion than they had the year before.

Table 3: Largest difference between first and second division bowling average, 2000–2009

Division One Division Two ---------------------------------- ----------------------------------- Name I B R W Ave I B R W Ave diff -------------------------------------------------------------------------------------------------------- PJ Franks 65 5,119 3,202 66 48.52 92 8,295 4,830 161 30.00 18.52 JC Tredwell 95 9,793 5,516 127 43.43 28 4,091 1,838 69 26.64 16.80 JF Brown 40 6,350 2,930 64 45.78 139 19,944 8,891 277 32.10 13.68 TJ Murtagh 45 3,642 2,215 57 38.86 79 7,603 4,381 168 26.08 12.78 RDB Croft 36 5,419 3,051 66 46.23 199 29,149 13,322 398 33.47 12.75 AJ Hall 62 5,819 3,027 98 30.89 53 3,564 1,743 81 21.52 9.37 DD Masters 72 6,698 3,678 101 36.42 116 12,946 5,467 200 27.34 9.08 NM Carter 106 10,419 6,307 156 40.43 30 2,812 1,640 52 31.54 8.89 DA Cosker 33 4,917 2,795 61 45.82 120 14,262 6,676 180 37.09 8.73 GJ Kruis 64 6,234 3,470 90 38.56 26 3,507 1,961 64 30.64 7.91 IDK Salisbury 114 11,658 6,242 174 35.87 43 4,878 2,527 90 28.08 7.80 PN Weekes 77 6,234 3,407 72 47.32 59 5,161 2,469 62 39.82 7.50 GP Swann 105 11,723 5,700 150 38.00 74 8,396 4,378 143 30.62 7.38 GJ Batty 58 7,199 3,611 92 39.25 124 13,907 6,635 204 32.52 6.73 RJ Kirtley 118 12,629 6,596 215 30.68 57 6,529 3,308 138 23.97 6.71 BJ Phillips 52 4,643 2,258 61 37.02 59 4,388 2,083 68 30.63 6.38 K Ali 42 4,339 2,629 84 31.30 131 12,418 7,364 290 25.39 5.90 CE Shreck 79 9,262 5,194 154 33.73 29 3,533 2,006 72 27.86 5.87 DG Cork 119 10,912 5,185 179 28.97 71 7,519 3,722 156 23.86 5.11 CT Tremlett 93 9,752 5,250 172 30.52 42 3,890 2,197 86 25.55 4.98 ... SJ Harmison 76 8,003 3,936 173 22.75 53 5,687 2,897 106 27.33 -4.58 AR Caddick 40 4,855 2,747 108 25.44 99 12,728 7,422 246 30.17 -4.74 OD Gibson 49 5,247 3,118 129 24.17 47 5,432 3,050 104 29.33 -5.16 AD Mullally 36 4,843 1,988 95 20.93 50 5,414 2,422 92 26.33 -5.40 AR Adams 33 3,838 1,818 74 24.57 53 5,787 3,110 94 33.09 -8.52 JM Anderson 50 4,786 2,577 120 21.48 30 3,076 1,813 60 30.22 -8.74 JD Middlebrook 45 5,276 2,804 84 33.38 150 15,460 8,156 187 43.61 -10.23 RL Johnson 38 4,623 2,388 105 22.74 102 10,242 5,712 166 34.41 -11.67 DL Maddy 111 6,770 3,533 127 27.82 74 3,905 2,143 54 39.69 -11.87 AJ Tudor 64 5,586 3,377 116 29.11 54 4,290 2,710 61 44.43 -15.31 qual. = 50 wkts in each division; full list available here

There's a good number of county stalwarts – and few bowlers that many would identify as being really top-rate – at the head of this list. It is this table that is most suggestive, to me, of an essential divide between the two strata of the domestic game: I find it quite hard to resist the conclusion that there is such a thing as a journeyman bowler who can do an effective job in the lower division, but lacks the penetration to transfer those results to the top flight. In contrast, there are a fair few bowlers who have managed to rise to the challenge of the first division and, by and large, these seem to be some pretty good players, to me. Mainstays of England's bowling attack in the beginning, middle, and end of the decade are amongst them: over the decade, Caddick, Harmison, and Anderson all averaged at least 4½ runs fewer in division 1 than they did in division 2.

(By the way, my eye was also caught by the fact that there's quite a few spinners in the upper reaches of the table and few in the bottom, so I looked to see if twirlers in general have found the going any harder in the top division. They haven't – in fact, they average ever-so-slightly less in the top flight.)

Taken together, this evidence suggests that, on average over the decade, first division cricket has been a couple of runs per wicket stronger than the division two game. Perhaps surprisingly, I can't detect any evidence of the gap getting any wider over time: there appears to have been a gulf of approximately two runs from the start of the period and, when I regressed season-to-season variation against year, I didn't get any significant results.

Here's a final stat to round things off. We were told that the whole point of two-divisional cricket was to increase competitiveness in the domestic FC game which, in turn, was supposed to improve the England test team. Well, it's all a bit post hoc ergo propter hoc but, in the 2000s, England won 42.6% of their test matches, which was a substantial improvement on their success-rate in the 1990s (24.1%), and their best since the 1950s. I'm sure those who were enthusiastic about the introduction of the new structure would consider that evidence enough that the reforms have served their purpose.


Anyone who's not particularly interested in Somerset can stop reading, now. Since Somerset have spent half of the decade in each division, there's a reasonable amount of data available on how players got on at either level of the game.
Note that the data are not limited to games for Somerset; it's just the overall records of those who have a Somerset connection.

Table 4: Largest difference between first and second division batting average, 2000–2009: Somerset players

Division One Division Two ------------------------ ------------------------ Name I NO R Ave I NO R Ave diff ----------------------------------------------------------------------------------- JL Langer 47 3 1,914 43.50 53 4 3,093 63.12 -19.62 KA Parsons 50 4 1,324 28.78 33 6 1,036 38.37 -9.59 PD Trego 74 10 2,039 31.86 40 5 1,410 40.29 -8.43 ID Blackwell 105 5 3,985 39.85 84 9 3,558 47.44 -7.59 SRG Francis 26 13 110 8.46 37 14 351 15.26 -6.80 PS Jones 60 15 692 15.38 63 15 1,057 22.02 -6.64 AR Caddick 29 7 252 11.45 68 14 937 17.35 -5.90 JC Hildreth 51 4 1,738 36.98 97 9 3,539 40.22 -3.24 J Cox 73 6 2,823 42.13 45 3 1,840 43.81 -1.68 CM Willoughby 30 15 110 7.33 50 20 253 8.43 -1.10 PD Bowler 68 7 2,655 43.52 37 7 1,329 44.30 -0.78 M Burns 73 3 2,422 34.60 65 5 2,085 34.75 -0.15 KP Dutch 47 7 944 23.60 25 1 569 23.71 -0.11 RJ Turner 73 7 1,811 27.44 54 13 1,076 26.24 1.20 MJ Wood 65 2 2,071 32.87 83 4 2,407 30.47 2.40 RL Johnson 32 7 669 26.76 78 8 1,388 19.83 6.93 ME Trescothick 74 4 3,914 55.91 41 2 1,835 47.05 8.86 AV Suppiah 31 1 1,328 44.27 34 0 998 29.35 14.91 NRD Compton 34 3 1,289 41.58 50 2 1,264 26.33 15.25

In common with the national trend, most players did at least a bit worse in division one than they did in division two. Nevertheless, it is quite encouraging to see, at the very bottom of the table, that the three batsmen who are quite likely to make up Somerset's 2010 top three have each done conspicuously better in top-flight cricket than in the second division.

Table 5: Largest difference between first and second division bowling average, 2000–2009: Somerset players

Division One Division Two ----------------------------------- ----------------------------------- Name I B R W Ave I B R W Ave diff ------------------------------------------------------------------------------------------------------------ JID Kerr 13 1,132 694 12 57.83 12 716 545 13 41.92 15.91 KP Dutch 40 3,590 1,962 46 42.65 26 2,231 1,199 42 28.55 14.10 BJ Phillips 52 4,643 2,258 61 37.02 59 4,388 2,083 68 30.63 6.38 CM Willoughby 53 6,286 2,987 103 29.00 79 8,244 4,525 161 28.11 0.89 PS Jones 86 9,776 5,695 154 36.98 94 8,740 5,323 142 37.49 -0.51 ID Blackwell 102 10,567 4,496 120 37.47 87 9,507 4,600 114 40.35 -2.88 PD Trego 74 4,954 3,197 88 36.33 46 3,061 2,045 50 40.90 -4.57 AR Caddick 40 4,855 2,747 108 25.44 99 12,728 7,422 246 30.17 -4.74 M Burns 39 2,093 1,308 36 36.33 30 1,322 754 18 41.89 -5.56 SRG Francis 28 2,056 1,381 38 36.34 54 4,678 3,123 73 42.78 -6.44 RL Johnson 38 4,623 2,388 105 22.74 102 10,242 5,712 166 34.41 -11.67 AV Suppiah 22 1,415 764 15 50.93 22 915 656 7 93.71 -42.78 Z de Bruyn 28 1,347 846 13 65.08 14 894 590 5 118.00 -52.92

Actually, it turns out that the majority of Somerset bowlers have done better in division one than in division two. That Suppiah ends up at the bottom of both lists reflects well on the way he has improved as Somerset have faced the challenge of top-flight cricket (though, admittedly, his first division average is still over 50).

20 January 2010

Think about it, and then... field?

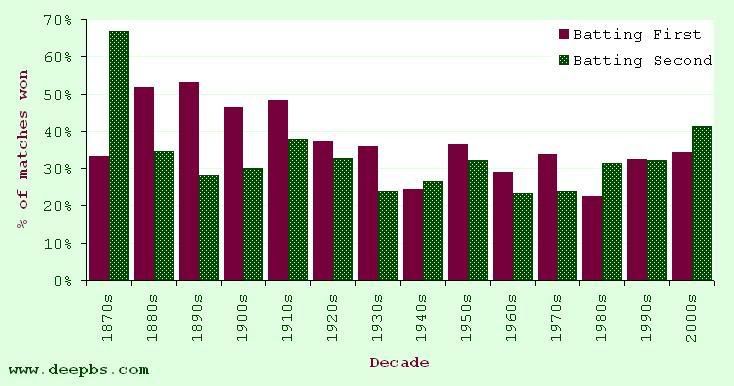
This isn't really a stats post; I just thought it was an opportune moment to draw attention to something which surprisingly few cricket-watchers appreciate: that teams are more likely to win test matches – and less likely to lose them – if they bat second.

This has not always been the case, but it has been consistently true for a few decades, now. Since the beginning of 1980, 333 tests have been won by sides batting first; 383 by those having second dig. In other words, the team batting second has been about 15% more likely to win.

Figure 1: Percentage of matches won batting first and second – test cricket

Percentage of matches won batting first and second – test cricket

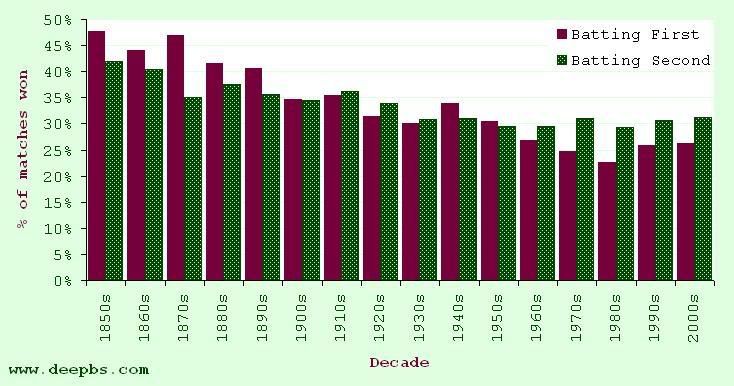
This phenomenon is shown even more clearly if we cast the net wide enough to encompass all first-class cricket. Since about 1960, somewhere in the region of 25% of games have been won by teams batting first; for those who fielded first-up, that figure rises to around 30%.

Figure 2: Percentage of matches won batting first and second – all first-class cricket

Percentage of matches won batting first and second – all first-class cricket

I should be clear that there is absolutely nothing original about these observations: some of the more competent cricket statisticians – Charles Davis in the vanguard – have been banging on about it for years. The reason I raise it is that I think the recent test series between South Africa and England provides a really neat illustration of one of the key reasons why this should be, and why it might be worth questioning the bias towards batting first that still prevails amongst captains winning the toss. Above all, it is conspicuous that, in all four tests, the side who batted first failed to win, and the side who fielded first got the result they wanted out of the last day.

Famously, in both the first and third tests of the series, England clutched draws from the jaws of defeat; in both instances, they had lost nine fourth-innings wickets, and South Africa were left rueing their failure to claim that last scalp. Another feature shared by these two tests was that South Africa had declared their second innings, Graeme Smith judging the target to set England and, more importantly, the amount of time his bowlers would need to dismiss them. In each case, the tourists got nowhere near their nominal target: they were 135 runs short at Centurion and 169 behind when time ran out in Cape Town. This is important; it turns out that – had he known in advance exactly how many England would score – Smith could have declared much earlier and, surely, his bowlers would not have needed much additional time before they would have claimed that elusive last wicket. Ultimately, South Africa had excess runs up their sleeve – runs they didn't need, runs that they had spent time accumulating.

Well, maybe if Smith were an astonishingly prescient captain, he could have set England what might have looked like generous targets, and all would have been well for him. I didn't see him get much criticism for delaying his declarations in post-match coverage, and I'm sure that's fair enough: it would have been difficult to predict events as they transpired, and I certainly wouldn't want to undermine the praise that Graham Onions and rearguard cohorts rightly received for their efforts.

It's worth emphasising, though, that – monstrous first-innings leads aside – these decisions are never faced by the side batting second. There is never a question of excess runs for them: to win the match, they have to score just one more than their opponents amassed. As a thought experiment (I know there are good reasons to object to this, but go with it for now), imagine that everything had been the same in those two tests, but with the order of innings reversed. So we have England's sub-par first innings followed by a decent score from the hosts and, then, England batting third scraping together a dogged 200-and-some. Let's be generous to the last pair, and say they would have lasted an additional 10 overs, and scored 25 runs in the process. As a result, at Centurion, South Africa would have had 75 overs in which to score 191 runs; looks straighforward enough, as confirmed by the fact that they managed 301 in 85.5 overs in their real-life second innings. At Cape Town, the equation would have been 303 from 101; that looks a bit more challenging, but it's worth remembering that they got 447 in 111.2 overs in the second innings they actually played in that match.

Okay, so this is artificial, and it entirely overlooks the effect that match dynamics and conditions had over the runs that were scored in the games as played. Naturally, I accept that, for a combination of these reasons, it is invariably harder to make a given score in the fourth innings of a match than it is to do so in the third. What this hypothetical scenario does show, however, is that – all other things being equal – the side that bats second has a double-faceted advantage over the the side that bats first: if they are in a winning position, they are more likely to be able to force a win, because they won't be delayed by the scoring of surplus runs, and, if they are in a losing position, they are more likely to salvage a draw, because they will have less time to bat out.

In Durban and in Johannesburg, the gulf between the two sides was such that it's hard to imagine the toss, and the order in which the teams batted, having had any real influence on the outcome. Nevertheless, it's worth noting that, in both cases, the side that ultimately won the game lost the toss and was asked to field first. In both cases, the losing side's fate was sealed by a third-innings capitulation in the face of a daunting deficit after each side's first dig. Again, though, this is a match situation that is unique to teams taking first knock. Unless the gulf is so great that you're asked to follow-on (which has its compensations), this sort of intimidating prospect is never faced by the team that bats second. Even if you have conceded a first-innings deficit of hundreds of runs, it's still up to your opponents to bat again, taking time out of the match that may or may not prove necessary to their cause. By the time you do get to bat, you will have no more prospect of winning the game, but the draw might be a credible aspiration.

When was the last time you saw a fielding side shut up shop and force a draw from a position in which, time constraints aside, they would surely lose? I can remember very few instances (this one leaps to mind with embarrassingly fresh rancour twenty years on), but the side batting fourth manages something like it all the time. And, if the side batting second is more likely to force a draw from a losing situation, the side batting first is less likely to win from a winning situation.

Actually, in Johannesburg, had England batted for anything like the ten hours they managed in Cape Town, that would almost certainly have been enough, in conjunction with the frequent rainstorms that were knocking around, to have saved the test match. But the prospect of batting for a day and a half in an unwinnable match situation is, it seems clear to me, somewhat easier when there's only a day and a half left in the match. Instead, as their hosts had two tests before, England crumpled in the face of the task ahead of them (and, it has to be admitted, conditions were probably less conducive to rearguard heroics at the Wanderers).

So what does this imply for the modern captain at the toss? As Charles Davis points out, captains who mistakenly choose to field first routinely get pilloried, whereas those who mistakenly choose to bat are seldom criticised, so you can't blame them for erring towards taking first dig. However, I'd say that the draws in Centurion and Cape Town absolutely vindicated Andrew Strauss's decision to send South Africa in; I haven't seen him get any credit for either decision and, according to the logic set out above, I reckon England would have lost if they had batted first (assuming, of course, that the games had followed an otherwise similar shape). Conversely, I'm not nearly so sure it was smart of him to elect to bat first in Johannesburg.

I emphasised the all other things being equal, above, and it is only if this assumption (or something like it) holds true that we can automatically assume that the side batting second is at a significant advantage. Frequently, all other things will not be equal, and there will be good reasons to bat first – most notably, when you expect the pitch to deteriorate significantly as the match progresses. The fact that the advantage for sides batting second has developed over time may be seen as evidence that such pitches have become progressively rarer. In other words, the advantage of having the best of the conditions was, in the past, sufficient to outweigh the increased risk of running out of time in which to win. Clearly, though, that equation has reversed as time has gone on.

The statistics and common sense strongly suggest that the modern captain should be looking for reasons not to field, rather than adopting bat-first as default. Obviously, conditions can make the captain's decision straightforward, one way or the other. But, in instances where he perceives no clear advantage to batting or fielding, I submit that a captain who is sensitive to the trends of modern cricket should have a bias towards sending the opposition in. In fact, if you look back at Figure 2, it seems that the last time WG Grace's famous exhortation to bat first under any circumstances really held true was... well, in WG Grace's day.


UPDATE: David makes a couple of good points in the comments below. Firstly, as he says, if you discount matches involving Bangladesh from the test figures, the trend is diminished a bit – from a 15% advantage for teams batting second down to a 10% one since the beginning of 2000. If you discount Zimbabwe, too, it drops a couple of points further. In a way, though, this is kinda the point: batting second enables you to win the matches you should win more reliably (though, as David points out, the motivation, in extreme cases, may be just to get the match over and done with as swiftly as possible).

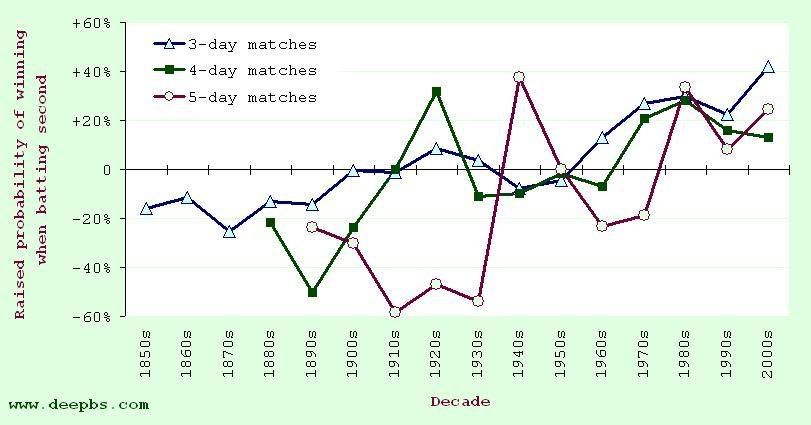
His second suggestion is that the advantage for teams batting second should be greater in matches of shorter duration (because the disadvantage of batting first – i.e. running out of time in which to force a win in matches you're dominating – will be exaggerrated). This sounds plausible, and the evidence for it is suggestive if not compelling. The new figure, below, shows how the advantage for teams batting second has developed over the last 160 years' FC cricket in 3-, 4-, and 5-day matches.

Figure A1: Advantage batting second – all first-class cricket

Advantage batting second

As expected, 3-day cricket has led the way, with a consistently rising trend over time, culminating in over 40% more 3-day games being won by the team batting second in the 2000s. Still, the longer games aren't far behind: since 1980, teams batting second have won more frequently than those batting first in all three lengths of the FC game. Though the benefit of batting second may be amplified in shorter games, there still seems to be an advantage on offer regardless of a match's duration.

15 January 2010

The 2000s: a top-class decade

As you'd expect at the turn of a decade, we seem to be inundated by reviews and lists. However, for some strange reason, everyone's been exclusively focusing on international cricket. I've just updated my database to the end of 2009, so this is a quick trivia post to fill that yawning gap in the record-books, by looking back at all top-level cricket played in the 2000s. These analyses aggregate all first-class, list-A-status limited-overs games, and recognised Twenty20 matches. I know, I know. What would you do without me, eh?

We start with the batsmen. The man with most competitive runs in the 2000s may be a suprise to some: Murray Goodwin found himself at the crease more often than anyone else in the decade, and accumulated just five shy of 26,000 runs in the process. He amassed a substantial majority of those runs – 18,480 – in Sussex colours, another 5,033 for Western Australia, and the remainder for Zimbabwe and Warriors. (The record for runs in a decade, by the way, is held by Graham Gooch, who racked up 33,269 in the 1980s.)

Mike Hussey is the only other man to exceed 25,000 top-level runs, and another stalwart overseas pro on the English county scene, Michael Di Venuto, is third on the list. He also has most FC runs, and most boundary 4s (who cleared the fence most often? Shahid Afridi, of course, with 418 6s in all forms of cricket). Ponting has most centuries (pipping Ramprakash by one), Sangakkara has most limited-overs runs, and Brad Hodge tops the T20 list.

Table 1: Most runs in all forms of competitive cricket, 2000–2009

Name I NOs R Ave SR 100 50 4s 6s FC_Runs LO_Runs T20_Runs 1. MW Goodwin 669 69 25,995 43.33 64.79 67 121 3,114 153 16,555 8,174 1,266 2. MEK Hussey 595 99 25,659 51.73 60.44 52 146 2,867 188 15,221 9,697 741 3. MJ Di Venuto 626 44 24,140 41.48 66.82 55 132 3,274 88 16,681 6,508 951 4. KC Sangakkara 593 56 23,106 43.03 68.38 45 129 2,532 134 11,078 10,522 1,506 5. SM Katich 546 63 23,078 47.78 61.19 50 139 2,689 159 15,539 6,485 1,054 6. RT Ponting 498 58 22,963 52.19 73.36 72 118 2,533 252 12,440 10,063 460 7. RS Dravid 545 73 22,919 48.56 56.14 45 143 2,525 98 12,530 9,599 790 8. BJ Hodge 524 61 22,560 48.73 68.29 66 89 2,754 205 13,612 6,582 2,366 9. MR Ramprakash 452 63 22,093 56.79 61.46 71 94 2,482 260 15,379 5,326 1,388 10. JL Langer 516 39 22,083 46.30 67.12 63 97 2,664 173 16,310 4,758 1,015 11. ME Trescothick 536 33 22,012 43.76 70.45 58 114 3,016 237 12,236 8,735 1,041 12. DPMD Jayawardene 580 59 21,402 41.08 65.69 44 106 2,169 164 11,599 8,805 998 13. CH Gayle 527 39 21,155 43.35 72.20 50 112 2,449 321 11,246 9,046 863 14. ML Hayden 473 40 21,068 48.66 69.75 53 103 2,469 262 12,254 7,745 1,069 15. DS Lehmann 422 61 20,998 58.17 77.50 51 110 2,374 153 12,875 7,742 381 16. M van Jaarsveld 550 68 20,848 43.25 63.79 52 117 2,467 149 12,682 6,593 1,573 17. SP Fleming 551 38 20,038 39.06 66.14 39 116 2,543 221 9,912 8,969 1,157 18. OA Shah 552 61 19,921 40.57 64.62 41 115 2,174 260 11,255 7,242 1,424 19. JH Kallis 466 79 19,680 50.85 58.19 44 121 2,007 199 10,230 8,381 1,069 20. SG Law 501 47 19,644 43.27 67.29 42 108 2,538 109 13,451 4,996 1,197 21. S Chanderpaul 482 89 19,269 49.03 54.99 43 113 1,760 126 11,392 7,554 323 22. SR Tendulkar 426 42 19,191 49.98 70.28 51 94 2,414 146 9,015 9,426 750 23. AJ Strauss 530 26 19,188 38.07 60.68 42 94 2,479 50 12,557 6,112 519 24. GC Smith 464 34 19,088 44.39 70.72 39 106 2,303 116 9,402 7,830 1,856 25. V Sehwag 504 23 18,668 38.81 93.01 38 85 2,611 296 8,953 8,462 1,253 26. JA Rudolph 473 50 18,645 44.08 60.32 41 99 2,346 106 11,411 6,252 982 27. KP Pietersen 448 47 18,566 46.30 79.81 50 88 2,094 316 10,960 6,600 1,006 28. BF Smith 559 72 18,370 37.72 60.10 30 110 2,179 84 11,797 5,707 866 29. VS Solanki 554 34 18,365 35.32 71.39 32 101 2,487 183 9,701 7,554 1,110 30. RWT Key 497 41 18,109 39.71 59.87 43 80 2,226 113 12,725 4,271 1,113 qual. = 50 inns; full list available here

The list of bowlers of the 2000s is dominated by one man: Muttiah Muralitharan. Not only has he taken most wickets in all cricket, he has bowled most balls, recorded most maidens, and collected most five-wicket hauls. He also tops the wickets lists for FC and one-day cricket (Tyrone Henderson has most T20 wickets, 84). Danish Kaneria is the only other bowler to exceed 1,000 scalps in all cricket, but he also has the unenviable distinction of having conceded more runs than anyone else in the 2000s.

Those of us who have witnessed his sedulous toil at Taunton over the second half of the decade will be unsurprised to learn that Charl Willoughby bowled more balls in top-level cricket than any other seam bowler of the 2000s. However, it requires no local knowledge to guess the identity of the bowler with most wides against his name: Steve Harmison is the only man for whom the umpires spread their arms more than 500 times last decade. Similarly, the revelation that Brett Lee bowled 366 more no-balls than anyone else is anything but a shock.

Table 2: Most wickets in all forms of competitive cricket, 2000–2009

Name I Balls M R W wd nb Ave Econ SR 5WI FC_W LO_W T20_W 1. M Muralitharan 528 54,100 1,864 25,416 1,296 257 230 19.61 2.82 41.74 82 816 421 59 2. Danish Kaneria 460 51,093 1,599 26,840 1,069 115 132 25.11 3.15 47.80 62 811 203 55 3. Yasir Arafat 510 35,902 867 23,847 995 275 584 23.97 3.99 36.08 41 615 302 78 4. SK Warne 457 46,011 1,321 24,958 982 279 156 25.42 3.25 46.85 44 723 224 35 5. Z Khan 488 37,767 1,026 24,344 868 469 644 28.05 3.87 43.51 30 524 303 41 6. CM Willoughby 497 40,375 1,570 21,757 863 345 64 25.21 3.23 46.78 34 600 193 70 7. AJ Bichel 456 36,381 1,124 22,071 848 368 317 26.03 3.64 42.90 28 556 259 33 8. M Ntini 484 38,178 1,173 22,901 843 252 225 27.17 3.60 45.29 28 515 308 20 9. Harbhajan Singh 468 42,607 1,065 23,500 826 215 36 28.45 3.31 51.58 36 520 265 41 10. Mushtaq Ahmed 350 35,893 951 20,431 806 163 34 25.35 3.42 44.53 54 635 129 42 11. B Lee 429 32,241 827 21,206 792 448 1,126 26.78 3.95 40.71 25 409 349 34 12. WPUJC Vaas 495 36,389 1,145 19,940 760 174 608 26.24 3.29 47.88 18 431 312 17 13. SCG MacGill 349 36,620 991 22,723 752 112 139 30.22 3.72 48.70 36 580 166 6 14. SJ Harmison 417 36,096 1,115 20,880 746 551 254 27.99 3.47 48.39 25 557 174 15 15. Naved-ul-Hasan 384 28,083 664 18,653 741 300 716 25.17 3.99 37.90 25 459 242 40 =15. MJ Hoggard 421 36,767 1,237 20,574 741 215 404 27.77 3.36 49.62 23 573 155 13 17. GD McGrath 378 30,119 1,350 14,340 740 134 289 19.38 2.86 40.70 25 429 291 20 18. RJ Kirtley 434 30,902 977 19,002 732 400 177 25.96 3.69 42.22 26 402 279 51 19. RDB Croft 465 45,754 1,356 24,489 729 125 13 33.59 3.21 62.76 23 512 171 46 20. CW Henderson 450 43,024 1,539 21,623 725 127 35 29.82 3.02 59.34 21 467 208 50 21. J Lewis 387 32,288 1,214 18,009 713 187 355 25.26 3.35 45.28 27 486 186 41 22. AJ Hall 484 30,344 920 17,938 710 351 270 25.26 3.55 42.74 16 379 260 71 23. SM Pollock 477 34,497 1,373 16,957 700 172 636 24.22 2.95 49.28 9 320 335 45 24. K Ali 399 26,871 709 18,285 689 211 449 26.54 4.08 39.00 23 429 227 33 25. A Kumble 340 37,093 1,130 19,836 676 96 328 29.34 3.21 54.87 28 484 155 37 26. AR Caddick 345 32,963 1,047 19,637 675 166 634 29.09 3.57 48.83 36 521 139 15 27. S Weerakoon 302 28,418 1,087 13,557 673 27 6 20.14 2.86 42.23 37 529 126 18 28. JN Gillespie 437 35,974 1,305 18,829 672 273 254 28.02 3.14 53.53 19 445 208 19 29. IJ Harvey 425 26,055 806 15,676 669 239 133 23.43 3.61 38.95 17 281 336 52 30. HMRKB Herath 344 32,941 1,133 15,833 660 46 71 23.99 2.88 49.91 30 515 121 24 qual. = 50 inns bowled; full list available here

Five men amassed 10,000 runs and took 500 wickets in all cricket: Andrew Flintoff, Ian Harvey, Andrew Hall, Afridi, and Robert Croft.

The decade's leading wicket-keepers were Adam Gilchrist (c 819, st 91), Mark Boucher (c 844, st 55) and Chris Read (c 754, st 86). The 2,443 byes let through by Matthew Prior were 300 more than any other keeper conceded. Amongst those without gloves, Martin van Jaarsveld's 439 catches were over 50 more than anyone else managed.

I'm going to try to post an analysis of the decade's English County Championship cricket over the next few days – not least because, while assembling this post, it's dawned on me that we've now had a decade's worth of two-divisional domestic cricket in this country.

1 January 2010

Ploughing your own furrow or making hay?

Following discussion of the oft-repeated stat about Ian Bell never scoring 100 if no-one else has, Spaceman! of the TMSB Exiles wanted to know

... who has the best average when no-one else in the innings has scored a 50/100?

This is a really neat little question, with what I think are some quite revealing answers.

Table 1 shows the career records of batsmen in innings in which no-one (other than the batsman himself) made it to 50. For comparison, the remainder of each player's career (i.e. innings where at least one team-mate scored a half-century) is shown alongside, and the relative difference between batting averages in the two scenarios is given in the final column.

Table 1: Test batting records divided into innings in which no other batsmen made 50 and those in which at least one did

<--- no other batsman made 50 ---> <----- other batsmen made 50 -----> Name I NOs R Ave HS 50 100 I NOs R Ave HS 50 100 Diff% 1. BL D'Oliveira 14 5 614 68.22 114* 3 2 56 3 1,870 35.28 158 12 3 193.4% 2. SJ McCabe 13 4 594 66.00 189* 1 2 49 1 2,154 44.88 232 12 4 147.1% 3. DL Amiss 17 7 657 65.70 262* 2 1 71 3 2,955 43.46 203 9 10 151.2% 4. KS Ranjitsinhji 10 3 437 62.43 154* 2 1 16 1 552 36.80 175 4 1 169.6% 5. KF Barrington 29 7 1,314 59.73 132* 6 3 102 8 5,492 58.43 256 29 17 102.2% 6. DL Haynes 53 20 1,968 59.64 143 8 5 149 5 5,519 38.33 184 31 13 155.6% 7. JB Hobbs 21 6 893 59.53 126* 9 1 81 1 4,517 56.46 211 19 14 105.4% 8. AI Kallicharran 17 5 708 59.00 126 4 2 92 5 3,691 42.43 187 17 10 139.1% 9. Saleem Malik 24 8 927 57.94 99 8 0 130 14 4,841 41.73 237 21 15 138.8% 10. H Sutcliffe 17 5 676 56.33 135 2 2 67 4 3,879 61.57 194 21 14 91.5% 11. NCL O'Neill 15 6 505 56.11 134 2 1 54 2 2,274 43.73 181 13 5 128.3% 12. DM Jones 20 5 838 55.87 184* 3 2 69 6 2,793 44.33 216 11 9 126.0% 13. L Hutton 46 13 1,817 55.06 202* 10 3 92 2 5,154 57.27 364 23 16 96.1% 14. RA Smith 25 6 1,031 54.26 148* 6 3 87 9 3,205 41.09 175 22 6 132.1% 15. RC Fredericks 24 5 1,029 54.16 138 5 3 85 2 3,305 39.82 169 21 5 136.0% 16. GC Smith 24 4 1,053 52.65 154* 6 2 113 5 5,386 49.87 277 20 16 105.6% 17. KC Wessels 13 2 578 52.55 118 4 1 58 1 2,210 38.77 179 11 5 135.5% 18. TT Samaraweera 16 2 723 51.64 125 5 2 74 11 3,215 51.03 231 16 9 101.2% 19. HP Tillakaratne 27 8 981 51.63 119 4 3 104 17 3,564 40.97 204* 16 8 126.0% 20. BC Broad 10 2 409 51.13 139 0 2 34 0 1,252 36.82 162 6 4 138.8% 21. IVA Richards 31 4 1,378 51.04 130 11 3 151 8 7,162 50.08 291 34 21 101.9% ... 27. BC Lara 63 2 2,976 48.79 226 15 8 167 4 8,936 54.82 400* 33 26 89.0% 28. G Boycott 51 13 1,828 48.11 121* 12 3 142 10 6,286 47.62 246* 30 19 101.0% ... 31. JH Kallis 40 9 1,466 47.29 162 7 3 183 23 8,930 55.81 189* 45 29 84.7% ... 36. KP Pietersen 19 1 812 45.11 142 3 3 81 3 3,987 51.12 226 13 13 88.3% 37. DCS Compton 36 7 1,308 45.10 158 7 3 95 8 4,499 51.71 278 21 14 87.2% ... 46. DG Bradman 13 2 485 44.09 131 1 3 67 8 6,511 110.36 334 12 26 40.0% ... 54. WR Hammond 31 5 1,095 42.12 113 4 1 109 11 6,154 62.80 336* 20 21 67.1% ... 66. V Sehwag 26 3 939 40.83 195 4 2 95 1 5,226 55.60 319 14 15 73.4% ... 73. GA Headley 17 1 631 39.44 107 3 2 23 3 1,559 77.95 270* 2 8 50.6% 74. AJ Strauss 28 5 905 39.35 128 4 2 98 0 4,462 45.53 177 14 16 86.4% ... 77. SR Tendulkar 52 5 1,837 39.09 122 9 5 213 23 11,133 58.59 248* 45 38 66.7% ... 79. SR Waugh 50 11 1,520 38.97 122* 7 3 210 35 9,407 53.75 200 43 29 72.5% ... 84. RS Dravid 49 13 1,387 38.53 118 8 1 186 14 9,846 57.24 270 50 27 67.3% ... 106. AC Gilchrist 16 2 516 36.86 144 2 1 119 18 4,959 49.10 204* 23 16 75.1% ... 109. RT Ponting 31 4 991 36.70 156 5 2 201 22 10,434 58.29 257 44 36 63.0% ... 115. AR Border 60 12 1,734 36.13 163 8 4 205 32 9,440 54.57 205 55 23 66.2% ... 122. GS Sobers 27 2 893 35.72 168 3 2 133 19 7,139 62.62 365* 27 24 57.0% ... 139. Yousuf Youhana 30 0 1,027 34.23 115 5 3 116 12 6,220 59.81 223 26 21 57.2% ... 195. IR Bell 15 2 385 29.62 83 3 0 76 7 2,906 42.12 199 18 9 70.3% ... 252. VT Trumper 29 2 704 26.07 159 2 1 60 6 2,459 45.54 214* 11 7 57.3% ... 298. PD Collingwood 13 2 251 22.82 74 1 0 83 8 3,481 46.41 206 17 9 49.2% ... 387. KR Miller 20 3 288 16.94 61 1 0 67 4 2,670 42.38 147 12 7 40.0% ... 483. RA Woolmer 10 2 73 9.13 19* 0 0 24 0 986 41.08 149 2 3 22.2% ... 487. LEG Ames 11 1 90 9.00 17* 0 0 61 11 2,344 46.88 149 7 8 19.2% ... 538. BS Chandrasekhar 14 7 20 2.86 6 0 0 66 32 147 4.32 22 0 0 66.1% 539. HK Olonga 10 1 19 2.11 5 0 0 35 10 165 6.60 24 0 0 32.0% 540. TM Alderman 13 6 10 1.43 4 0 0 40 16 193 8.04 26* 0 0 17.8% 541. CS Martin 17 6 6 0.55 4* 0 0 59 34 77 3.08 12* 0 0 17.7% qual. 10 innings in which no 50 was scored by other players; full list available here

The batsmen at the top of this list are those who scored most heavily when their team-mates went missing. Consequently, it is interesting to see a good proportion of individuals who are known for backs-to-the-wall grit amongst them, including McCabe, Barrington, Dean Jones, and Graeme Smith. By and large, the highest ranked players fall into one of two categories: those who consistently averaged well, regardless of what was going on around them (Barrington, Hobbs, Sutcliffe, Hutton), and those who appear to have raised their performance when their team-mates were doing less well. Our leader, Basil D'Oliveira, is the most conspicuous example of the latter: his average in innings in which the other ten failed to reach fifty is very nearly twice what he achieved when team-mates passed that landmark.

Perhaps the most notable feature of this analysis, though, is that it doesn't have a certain, familiar name at the top; indeed, it arguably does not reflect especially well on Bradman at all. When you spend as much time staring at cricket statistics as I do, you end up looking at Donald Bradman's record very closely indeed. This is the first time I have seen anything approaching objective evidence to corroborate the fairly pervasive anecdotal view that Bradman may have fallen short of his usual superhuman standards when circumstances were most hostile for batsmen. If we interpret the absence of 50-plus scores as a proxy for the presence of such conditions, perhaps it is significant that there are 45 test batsmen who have outperformed Bradman in those innings.

Mind you, if we're raising an eyebrow at the Don, we probably have to wag a finger at the Nugget. Keith Miller's record in innings in which none of his team-mates passed 50 is conspicuously dreadful. Only one of his 12 50s and none of his seven centuries came in such knocks, with the result that his stats have the appearance of a batsman who was most at home making hay while the sun shone (maybe he was just so damned sociable that he couldn't bear to make runs on his own).

It is also a bit surprising to note the terrible records of a couple of Ashes-winning Kent stalwarts. Neither Les Ames nor Bob Woolmer once passed 50 unless at least one of their team-mates had also registered a half-century; in fact, neither of them ever scored as much as 20 in such innings.

In contrast to the kinks in the middle of the table, it's reassuring to see things return to form at the bottom end. Poor old Chris Martin is as far adrift as ever: when no-one around – let's face it, above – him has made it to 50, he can only be expected to score a run every other innings.

Table 2 shows exactly the same kind of analysis but, this time, the threshold is the magical three figures.

Table 2: Test batting records divided into innings in which no other batsmen made 100 and those in which at least one did

<--- no other batsman made 100 ---> <----- other batsmen made 100 ----> Name I NOs R Ave HS 50 100 I NOs R Ave HS 50 100 Diff% 1. J Ryder 15 4 843 76.64 201* 5 2 17 1 551 34.44 112 4 1 222.5% 2. DG Bradman 44 5 2,860 73.33 334 7 11 36 5 4,136 133.42 304 6 18 55.0% 3. VG Kambli 13 1 843 70.25 227 0 4 8 0 241 30.13 82 3 0 233.2% 4. CAG Russell 13 2 708 64.36 140 0 5 5 0 202 40.40 96 2 0 159.3% 5. KS Duleepsinhji 10 2 484 60.50 173 2 1 9 0 511 56.78 117 3 2 106.6% 6. CP Mead 16 2 838 59.86 182* 2 3 10 0 347 34.70 102 1 1 172.5% 7. A Melville 10 2 475 59.38 117 1 3 9 0 419 46.56 189 2 1 127.5% 8. WR Hammond 90 13 4,569 59.34 336* 18 11 50 3 2,680 57.02 227 6 11 104.1% 9. JB Hobbs 68 7 3,518 57.67 187 21 9 34 0 1,892 55.65 211 7 6 103.6% 10. SJ McCabe 34 5 1,661 57.28 232 7 4 28 0 1,087 38.82 149 6 2 147.5% 11. RG Pollock 26 3 1,310 56.96 209 7 5 15 1 946 67.57 274 4 2 84.3% 12. JDB Robertson 15 2 729 56.08 133 6 2 6 0 152 25.33 44 0 0 221.4% 13. H Sutcliffe 51 8 2,400 55.81 161 13 7 33 1 2,155 67.34 194 10 9 82.9% 14. IVA Richards 112 10 5,661 55.50 291 25 17 70 2 2,879 42.34 178 20 7 131.1% 15. GA Headley 34 3 1,714 55.29 270* 4 7 6 1 476 95.20 169* 1 3 58.1% 16. KC Sangakkara 89 8 4,474 55.23 232 15 13 58 2 3,075 54.91 287 17 8 100.6% 17. KC Bland 27 4 1,263 54.91 144* 6 3 12 1 406 36.91 78 3 0 148.8% 18. CL Walcott 46 5 2,216 54.05 220 10 8 28 2 1,582 60.85 152 4 7 88.8% 19. EAB Rowan 38 5 1,760 53.33 236 11 3 12 0 205 17.08 67 1 0 312.2% 20. SR Watson 12 1 584 53.09 120* 4 1 9 0 236 26.22 53 2 0 202.5% 21. DR Jardine 17 3 740 52.86 127 7 1 16 3 556 42.77 98 3 0 123.6% 22. KF Barrington 87 10 4,035 52.40 151* 20 11 44 5 2,771 71.05 256 15 9 73.8% 23. L Hutton 93 14 4,102 51.92 205 21 10 45 1 2,869 65.20 364 12 9 79.6% 24. G Boycott 136 22 5,907 51.82 191 28 18 57 1 2,207 39.41 246* 14 4 131.5% 25. Yousuf Youhana 87 7 4,126 51.58 202 20 13 59 5 3,121 57.80 223 11 11 89.2% 26. RT Ponting 121 19 5,260 51.57 242 20 17 111 7 6,165 59.28 257 29 21 87.0% ... 40. GS Sobers 95 12 4,036 48.63 198 17 11 65 9 3,996 71.36 365* 13 15 68.1% ... 43. BC Lara 177 5 8,349 48.54 375 32 25 53 1 3,563 68.52 400* 16 9 70.8% ... 46. KP Pietersen 61 2 2,830 47.97 158 10 10 39 2 1,969 53.22 226 6 6 90.1% ... 52. JH Kallis 144 21 5,788 47.06 189* 33 13 79 11 4,608 67.76 186 19 19 69.4% ... 59. RS Dravid 148 22 5,873 46.61 270 31 9 87 5 5,360 65.37 233 27 19 71.3% ... 68. DT Lindsay 20 0 912 45.60 182 3 3 11 1 218 21.80 65 2 0 209.2% ... 71. ED Weekes 48 1 2,126 45.23 162 11 6 33 4 2,329 80.31 207 8 9 56.3% ... 84. GC Smith 80 9 3,152 44.39 154* 22 4 57 0 3,287 57.67 277 4 14 77.0% ... 91. V Sehwag 75 4 3,121 43.96 201* 10 8 46 0 3,044 66.17 319 8 9 66.4% 92. SR Tendulkar 166 17 6,544 43.92 248* 29 19 99 11 6,426 73.02 241* 25 24 60.1% 93. G Gambhir 27 3 1,051 43.79 167 5 2 21 0 1,502 71.52 206 5 6 61.2% 94. AJ Strauss 73 5 2,977 43.78 161 9 11 53 0 2,390 45.09 177 9 7 97.1% ... 146. VT Trumper 72 7 2,564 39.45 214* 9 7 17 1 599 37.44 135* 4 1 105.4% 147. PD Collingwood 53 7 1,813 39.41 135 11 3 43 3 1,919 47.98 206 7 6 82.2% ... 188. RA Woolmer 25 2 852 37.04 149 1 3 9 0 207 23.00 82 1 0 161.1% ... 211. AC Gilchrist 51 6 1,605 35.67 144 10 2 84 14 3,870 55.29 204* 15 15 64.5% ... 267. DW Randall 59 5 1,809 33.50 174 8 6 20 0 661 33.05 164 4 1 101.4% ... 336. IR Bell 49 3 1,400 30.43 97 14 0 42 6 1,891 52.53 199 7 9 57.9% ... 456. KR Miller 51 5 1,199 26.07 145* 3 2 36 2 1,759 51.74 147 10 5 50.4% ... 481. LEG Ames 40 5 892 25.49 126 4 1 32 7 1,542 61.68 149 3 7 41.3% ... 1140. JV Saunders 15 5 19 1.90 9 0 0 8 1 20 2.86 11* 0 0 66.5% 1141. M Mbangwa 20 7 24 1.85 8 0 0 5 1 10 2.50 5 0 0 73.8% 1142. CS Martin 58 31 46 1.70 7 0 0 18 9 37 4.11 12* 0 0 41.4% 1143. Mohammad Akram 11 3 11 1.38 5 0 0 4 3 13 13.00 10* 0 0 10.6% qual. 10 innings in which no 100 was scored by other players; full list available here

Although he is pipped to top spot by his first test skipper, Bradman's reputation might be restored somewhat by this analysis. It speaks volumes for his astonishing weight of runscoring that his unsupported average is the second-best in test history and is still only just over half as good as his performance when other batsmen got to three figures! On the opposite side of the coin, it is in keeping with Douglas Jardine's reputation as a batsman that his one test hundred and seven of his ten test fifties came in innings in which none of his team-mates had reached 100.

I love that Jack Hobbs is right near the top of the list (as he was in the 50s table), with a better record when he was going it alone than when his team-mates were joining in the fun. This finding is perfectly reflective of a quotation from Hobbs to which TMSB Exiles contributor rob.cricketpunk drew our attention in a related discussion. Speaking to John Arlott about batting for Surrey, Hobbs said,

If Sandy [Andy Sandham] was going well, we had plenty of batting to come and I would give one of my old bowler mates a chance; but if Sandy and Tom [Shepherd] and Andy [Ducat] got out, then I had to earn my money from Surrey and get some runs.

It also doesn't surprise me to find Viv Richards in the upper reaches, with quite a pronounced discrepancy between his unsupported and supported knocks. The fact that 17 of his 24 tons were achieved as sole centurion is characteristic of a man who loved to raise his game to meet an occasion.

So what about the man who sparked the whole debate off? Is it fair to get on Ian Bell's back for his apparently lopsided record? The defence has to plead guilty to the charge as it is commonly formulated: nobody in the history of test cricket has scored as many as Bell's nine centuries without ever being a lone centurion (Bill Woodfull is second with seven). Still, it's worth highlighting the extent to which, in terms of relative levels of performance between the two scenarios, Bell is far from the worst offender generally. He scores getting on for 60% as many runs in innings where no-one has reached three figures as he does when there is at least one centurion other than him, which puts him in the same ballpark as Weekes, Headley, Laxman, and Tendulkar, and a little way ahead of Miandad, Worrell, Dexter, and Miller. Although Bell has yet to be the only man to reach three-figures in a test innings, he has 14 half-centuries in innings in which no one passed 100 which, from 49 attempts, isn't terrible.

Moreover, when you look back at the innings in which no-one else passed 50 (which you have to think of as the most challenging circumstances of all – those in which Bell is supposed to be at his most inadequate), his record looks pretty okay. For example, we've all seen Bell's supposed mental frailty compared unfavourably to Paul Collingwood's supposed capacity for dogged resistance. Actually, Collingwood's record, in this area, is quite a lot worse. Of Collingwood's 27 test innings of 50 or more, there was one solitary occasion on which no-one else on the team registered at least a half-century (though, it has to be said, that was quite an important one), and his average of 22.82 in such innings is a fair bit worse than Bell's 29.62.

Ultimately, though, I remain to be convinced that any of this matters very much. It seems to me that successful teams need batsmen who can capitalise on good starts every bit as much as they need those whose heroics might rescue a parlous situation. The accepted wisdom is that the players who perform best when circumstances are least favourable are the most valuable; these are the kind of players we tend to call "matchwinners". But you'd never win any matches if you had to rely solely on batsmen who only turn it on when the spotlight is dialled up to sufficient wattage (I'm on record, elsewhere, advancing a similar argument in – slight – criticism of Viv Richards who, certainly over the later two-thirds of his career, was still capable of astonishing performances, but only tended to pull them out of the bag on a whim). After all, someone needs to score runs when they are most obviously there to be scored. So maybe we should stop repeating that stat about Ian Bell and start circulating a new one: England have never lost a test match in which he scored a century.


I feel obliged to offer a little postscript, here. Statistically speaking, I've done something deeply questionable, in these analyses. Assuming that apparent discrepancies between different subsets of batsmen's careers are meaningful on face value alone is pretty dumb. Actually, there is enough variation in all batsmen's records that, if you cut their record up into two random halves, you'd expect a good number of them to end up with two very different looking sets of performance. (David Barry gave a neat demonstration of this on his blog a little while ago.) This means that, even if all batsmen were equally good regardless of how well their team-mates got on in each of their innings, random variation alone would result in some of their records looking very different when you cut them up in the way I have, above. Distinguishing meaningful signal from random noise is at the heart of proper statistical analysis (it's what commonly gets labelled as identifying "statistical significance"), and it's really bad practice to stick up lists of numbers without doing anything of the sort. However, I'm not alone, in this respect: I'm not aware of anyone, ever, in the history of cricket stats taking this basic step. As it happens, I have (what I think are) some really good methods for beginning to make robust comparisons within and between batsmen's careers, but I'm unlikely to introduce them to this blog for a while, yet (partially because it'll take forever to write them up; partially because I'm kinda hoping to get them published in an academic journal, first). I just wanted to register the fact that all the above has a very good chance of being – like the vast majority of things presented as cricket statistics – absolute rubbish.